

Description
SBI Small Cap Fund Review 2026 covering returns, rolling returns, BOR, Alpha, Sharpe ratio, risk analysis, AUM, expense ratio and long-term performance.
Introduction
SBI Small Cap Fund Review 2026 provides a detailed analysis of one of India’s most popular small-cap mutual funds. This SBI Small Cap Fund Direct Growth review covers fund performance, risk measures, consistency, and long-term wealth creation potential. Investors searching for SBI Small Cap Fund Returns, SBI Small Cap Rolling Returns, and SBI Small Cap BOR Analysis can use this research to understand how the fund has performed across different market cycles.
The report also examines SBI Small Cap Fund Risk Analysis, including important metrics such as alpha, beta, standard deviation, downside capture ratio, and SBI Small Cap Alpha and Sharpe Ratio. These parameters help investors evaluate both returns and the risks taken to generate those returns.
Although the fund has delivered excellent long-term results, recent years have shown declining benchmark outperformance and weaker consistency. Therefore, this analysis compares the fund’s recent performance with category averages and benchmark returns to determine whether it still deserves a place among the Best Small Cap Mutual Funds 2026.
Investors seeking information about SBI Small Cap Fund Long Term Performance and looking for a complete SBI Small Cap Fund Review in India can use this report to make more informed investment decisions.

| Parameter | Details |
|---|---|
| Fund Name | SBI Small Cap Fund Direct Growth |
| Category | Small Cap Fund |
| Benchmark | BSE 250 SmallCap TRI |
| Investment Style | Small Cap Equity |
| Risk Level | Very High |
| Investment Horizon | Minimum 7–10 Years |
| Expense Ratio | Approximately 0.72% |
| AUM | ₹35,000+ Crore |
| Fund Manager | R. Srinivasan |
| Experience | More than 15 Years |
SBI Small Cap Return Analysis
| Entity | 1 Year | 3 Years | 5 Years | 10 Years |
| SBI Small Cap Fund | 5.96% | 14.13% | 15.48% | 19.53% |
| Category Average | 9.08% | 19.88% | 18.66% | 18.23% |
| Benchmark | 5.60% | 18.43% | 16.54% | 15.89% |
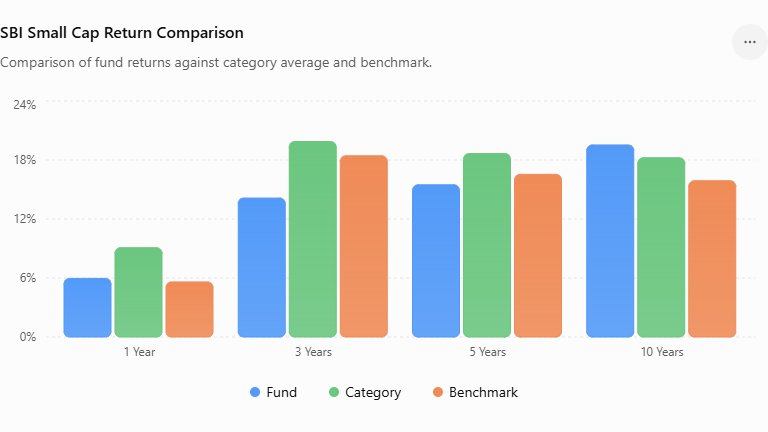
Analysis
The 1-year return indicates that the fund marginally outperformed the benchmark but lagged the category average.
Over the 3-year and 5-year periods, both category peers and the benchmark generated higher returns.
However, the 10-year CAGR of 19.53% demonstrates the fund’s exceptional wealth creation capability. Long-term investors have been rewarded despite recent underperformance.
SBI Small Cap Rolling Return Analysis
Rolling returns provide a better understanding of consistency because they measure performance across multiple investment periods.
Before 2020
| Horizon | Fund Return Range | Benchmark Return Range |
| 1-Year | 18.50% to 32.40% | 12.10% to 22.30% |
| 2-Year | 22.10% to 28.90% | 14.20% to 20.10% |
| 3-Year | 24.50% to 30.20% | 16.30% to 21.40% |
| 5-Year | 25.80% to 31.50% | 15.10% to 19.80% |
The fund consistently generated superior rolling returns before 2020.
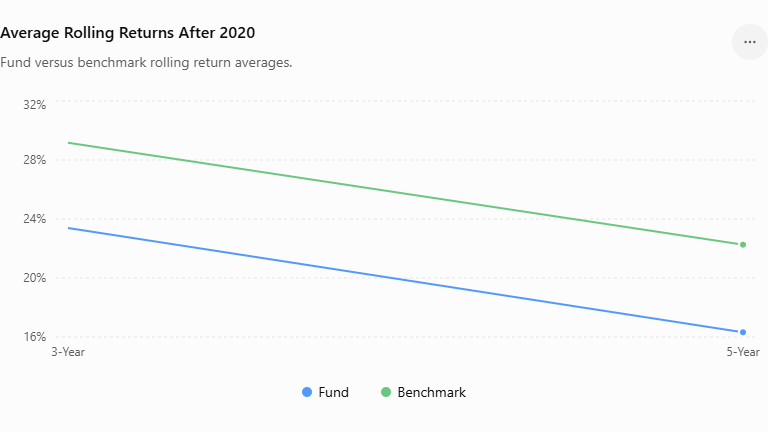
After 2020
| Horizon | Fund | Benchmark |
| 1-Year | -3.42% to 45.30% | 7.96% to 74.20% |
| 2-Year | 12.50% to 21.10% | 18.20% to 27.40% |
| 3-Year Average | 23.39% | 29.17% |
| 5-Year Average | 16.32% | 22.26% |
The benchmark has significantly outperformed the fund during recent years.
Benchmark Outperformance Ratio (BOR)
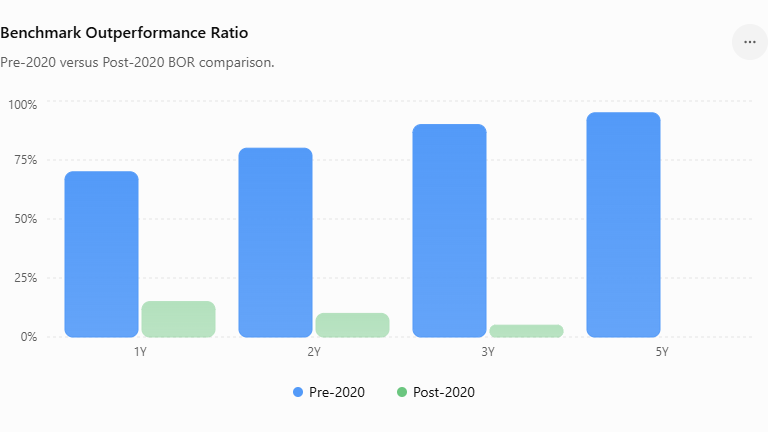
BOR measures how frequently a fund beats its benchmark.
| Rolling Period | Pre-2020 BOR | Post-2020 BOR |
| 1-Year | 70% | 15% |
| 2-Year | 80% | 10% |
| 3-Year | 90% | 5% |
| 5-Year | 95% | 0% |
BOR Interpretation
The decline in BOR clearly indicates reduced consistency.
- Before 2020, the fund beat the benchmark almost every time.
- After 2020, benchmark outperformance has sharply declined.
- The 5-year BOR of 0% is a major concern.
This is one of the most important findings in the analysis.
SBI Small Cap Dir Fund Risk Analysis
Alpha Analysis
Alpha measures the additional return generated by the fund manager.
| Horizon | Fund | Category | Benchmark |
| 3-Year | -3.17 | -0.07 | -0.92 |
| 5-Year | 0.66 | 2.23 | 3.27 |
| 10-Year | 4.54 | 2.63 | 4.15 |
Interpretation
The negative 3-year alpha indicates recent underperformance.
However, the 10-year alpha of 4.54 demonstrates the ability of the fund manager to create substantial long-term value.
Beta Analysis
| Horizon | Fund | Category | Benchmark |
| 3-Year | 0.75 | 0.86 | 0.49 |
| 5-Year | 0.70 | 0.83 | 0.39 |
| 10-Year | 0.77 | 0.84 | 0.58 |
Interpretation
A beta below 1 indicates lower market volatility.
The fund consistently shows lower beta than category peers, indicating better risk management.
Standard Deviation Analysis
| Horizon | Fund | Category | Benchmark |
| 3-Year | 17.11 | 19.86 | 15.49 |
| 5-Year | 15.10 | 17.89 | 14.74 |
| 10-Year | 19.36 | 20.99 | 16.70 |
Lower standard deviation indicates lower volatility.
The fund has maintained lower volatility than category peers despite investing in small-cap stocks.
Sharpe Ratio Analysis
| Horizon | Fund | Category | Benchmark |
| 3-Year | 0.46 | 0.63 | 0.51 |
| 5-Year | 0.61 | 0.69 | 0.47 |
| 10-Year | 0.71 | 0.61 | 0.53 |
Interpretation
The 10-year Sharpe ratio indicates excellent risk-adjusted returns.
Although short-term performance has weakened, long-term investors have been adequately compensated for the risks taken.
Tracking Error Analysis
| Horizon | Tracking Error |
| 3-Year | 6.53 |
| 5-Year | 6.74 |
| 10-Year | 7.33 |
Higher tracking error indicates active portfolio management.
This suggests that the fund manager takes independent investment decisions rather than merely replicating the benchmark.
R-Squared Analysis
| Horizon | Fund | Category | Benchmark |
| 3-Year | 94.59 | 92.22 | 17.40 |
| 5-Year | 90.24 | 89.61 | 14.21 |
| 10-Year | 89.89 | 90.88 | 22.33 |
The high R-Squared values show that the fund has maintained a strong relationship with the benchmark.
Upside Capture Ratio
| Horizon | Fund | Category | Benchmark |
| 3-Year | 70 | 85 | 40 |
| 5-Year | 72 | 85 | 42 |
| 10-Year | 86 | 87 | 62 |
The 10-year upside capture ratio of 86 indicates strong participation during bull markets.
Downside Capture Ratio
| Horizon | Fund | Category | Benchmark |
| 3-Year | 72 | 81 | 5 |
Lower downside capture indicates better downside protection.
The fund falls less than many category peers during market corrections.
Expense Ratio Analysis
| Parameter | Value |
| Expense Ratio | Approximately 0.72% |
Expense ratio directly affects investor returns.
A lower expense ratio helps investors retain more returns over long periods.
For an actively managed small-cap fund, the expense ratio remains competitive.
Assets Under Management (AUM)
| Parameter | Value |
| AUM | ₹35,000+ Crore |
Large AUM indicates:
- Strong investor confidence.
- Better operational efficiency.
- Long-term trust.
However, very large AUM in small-cap funds may sometimes make stock selection more challenging.
Fund Manager Experience
| Parameter | Details |
| Fund Manager | R. Srinivasan |
| Experience | More than 15 years |
An experienced fund manager plays a major role in controlling risk and generating long-term returns.
The fund’s long-term success is largely attributed to disciplined portfolio management.
Strengths
✔ Outstanding 10-year CAGR.
✔ Strong long-term alpha.
✔ Lower beta than category peers.
✔ Good downside protection.
✔ Lower volatility.
✔ Experienced fund manager.
✔ Large AUM and investor confidence.
Weaknesses
✘ Recent underperformance.
✘ Declining BOR.
✘ Weak short-term alpha.
✘ Benchmark outperforming after 2020.
✘ Category peers delivering better recent returns.
Risk Summary
| Parameter | Rating |
| Returns | ★★★★☆ |
| Rolling Returns | ★★★☆☆ |
| BOR | ★★☆☆☆ |
| Alpha | ★★★★☆ |
| Beta | ★★★★☆ |
| Sharpe Ratio | ★★★★☆ |
| Downside Protection | ★★★★☆ |
| Fund Management | ★★★★★ |
| Expense Ratio | ★★★★☆ |
| Overall Risk Management | ★★★★☆ |
Final Verdict
SBI Small Cap Fund remains one of India’s strongest long-term small-cap funds. Investors who stayed invested for a decade have generated substantial wealth.
However, recent years have shown declining benchmark outperformance, lower alpha generation, and reduced consistency.
Existing investors with long investment horizons may continue to hold the fund.
New investors should compare the fund with other leading small-cap funds before making fresh investments.
Overall Rating
| Category | Score |
| Long-Term Performance | ★★★★★ |
| Risk Management | ★★★★☆ |
| Consistency | ★★★☆☆ |
| Benchmark Outperformance | ★★☆☆☆ |
| Downside Protection | ★★★★☆ |
| Fund Manager Quality | ★★★★★ |
| Overall Rating | ★★★★☆ |
Final Conclusion: Existing Investors May Hold, New Investors Should Avoid Fresh Investments
SBI Small Cap Fund has historically been one of the most successful small-cap funds in India, delivering excellent long-term returns and creating substantial wealth over the last decade. However, the recent performance data presents a different picture.
The fund has significantly underperformed its benchmark and category peers over the last three to five years. The sharp decline in Benchmark Outperformance Ratio (BOR), negative short-term alpha, weaker rolling returns, and lower consistency indicate that the fund is no longer among the strongest performers in the small-cap category.
Several newer and actively managed small-cap funds have delivered better returns, stronger benchmark outperformance, and improved consistency in recent years. The large asset size of SBI Small Cap Fund may also make it increasingly difficult to identify attractive opportunities within the small-cap universe.
Therefore, existing investors with long investment horizons may continue holding their investments if they are comfortable with the recent underperformance. However, fresh investments may not be the best option at present.
New investors should carefully evaluate other leading small-cap funds that have demonstrated superior recent performance, stronger rolling returns, higher benchmark outperformance, and better risk-adjusted returns.
Based on the current data, SBI Small Cap Fund appears to be a “Hold” for existing investors rather than a “Buy” for new investors. Until the fund shows improvement in consistency, alpha generation, and benchmark outperformance, new investments can reasonably be avoided.