

Meta Description
Explore our DSP Small Cap Direct Fund 2026 review, covering long-term CAGR, rolling returns, and key risk metrics like Alpha, Beta, and Sharpe.
Introduction For DSP Small Cap Direct Plan Growth
Investing in small-cap mutual funds can be exciting, but it can also be risky. Small-cap funds invest mainly in smaller companies that may have the potential to grow into much bigger businesses in the future. Because these companies are still growing, their share prices can move up and down sharply.
In this review, we take a detailed look at the DSP Small Cap Fund Direct Growth option. Instead of looking only at recent returns, we examine the fund from different angles, including historical performance, rolling returns, Benchmark Outperformance Ratio (BOR), risk ratios, maximum drawdown, upside and downside capture, portfolio allocation, and fund size.
The fund has delivered strong long-term returns compared with its benchmark over several periods. Its rolling-return data also shows that its performance has generally become more consistent as the investment period becomes longer. However, investors should remember that small-cap funds can experience large falls during difficult market conditions.
This review is designed to help investors understand how the fund has behaved in the past. It is not a guarantee of future returns or a personal investment recommendation,
DSP Small Cap Fund CAGR Analysis
The annualized return (CAGR) data across 1-year, 3-year, 5-year, 7-year, and 10-year time horizons is summarized below alongside short-term absolute metrics:
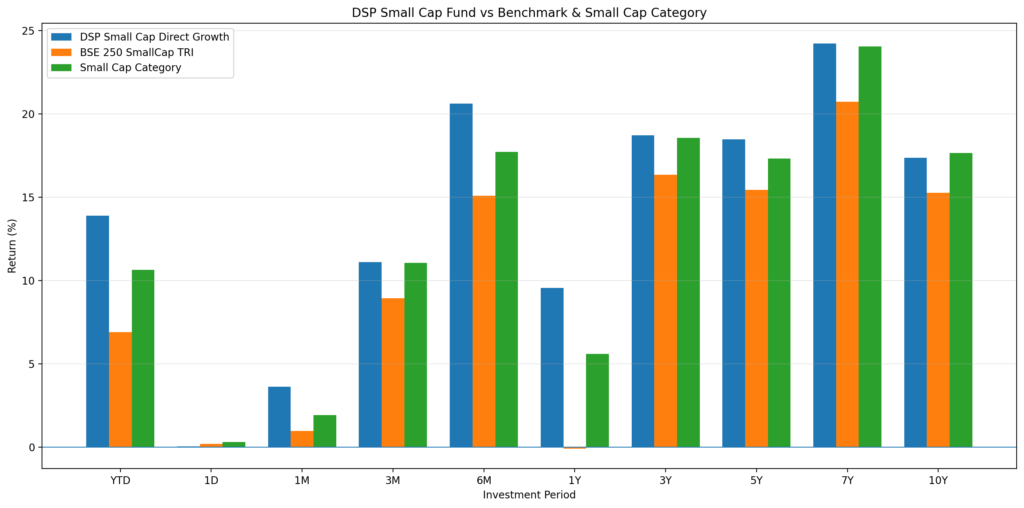
| Fund / Benchmark | 1Y | 3Y (CAGR) | 5Y (CAGR) | 7Y (CAGR) | 10Y (CAGR) |
| DSP Small Cap Dir | 9.56% | 18.72% | 18.48% | 24.24% | 17.37% |
| BSE 250 SmallCap TRI (Benchmark) | -0.07% | 16.36% | 15.45% | 20.73% | 15.28% |
| Equity: Small Cap (Category Average) | 5.60% | 18.56% | 17.32% | 24.05% | 17.67% |
1. Consistent Long-Term Alpha Generation
Performance Analysis & Insights
DSP Small Cap Fund (Direct) demonstrates a strong history of outperforming its primary benchmark, the BSE 250 SmallCap TRI, across every multi-year compounding period. Over a 7-year horizon, the scheme delivered a 24.24% annualized growth rate, creating a generous 3.51% spread over the benchmark’s 20.73%. Its 10-year track record (17.37% CAGR) similarly outpaces the benchmark’s 15.28%, highlighting the fund manager’s stock-selection capability over distinct market cycles.
2. Category Benchmark Comparison
When evaluated against the broader Small Cap Category Average:
- Outperformance: The fund comfortably beats the category average across 1-year (9.56% vs 5.60%), 3-year (18.72% vs 18.56%), and 5-year (18.48% vs 17.32%) frames.
- Marginal Lag over 10 Years: Over a decade, the fund’s 17.37% CAGR trails the peer average (17.67%) slightly by 30 basis points, though it maintains a clear lead over the broader index.
3. Downside Protection & Recent Resilience
In choppy short-term environments, the scheme shows impressive resilience. While the benchmark slipped into negative territory over 1 year (-0.07%), DSP Small Cap Direct managed positive territory at 9.56%, showcasing effective risk-adjusted management during market corrections. Short-term momentum remains strong as well, reflected in its 20.63% return over 6 months and 13.89% YTD return.
Summary Takeaway: DSP Small Cap Direct exhibits a robust growth profile suited for long-term investors. Its ability to shield capital during market dips while maintaining compounding rates above 18% CAGR over 3, 5, and 7 years makes it a compelling option within high-risk, high-reward equity allocations.
DSP Small Cap Fund Rolling Returns
📊 1-Year Rolling Return Statistics
This table shows what happens if you put your money into this investment fund (DSP Small Cap Fund) versus the broader market index (Nifty Smallcap 250 TRI) and checked how much it grew after 1 year—no matter when you started.
| Scheme / Category Name | Average | Median | Maximum | Minimum |
| DSP Small Cap Fund – Direct Plan – Growth | 27.47% | 20.01% | 125.74% | -30.87% |
| Nifty Smallcap 250 TRI | 23.21% | 12.15% | 135.79% | -41.65% |
🎯 Return Distribution (% of Times)
This shows how often the investment gave back a specific percentage of profit over a 1-year holding period:
| Scheme / Category Name | Less than 0% | 0 – 8% | 8 – 12% | 12 – 15% | 15 – 20% | Greater than 20% |
| DSP Small Cap Fund | 19.04% | 13.01% | 5.70% | 4.08% | 8.13% | 50.05% |
| Nifty Smallcap 250 TRI | 29.35% | 15.19% | 5.44% | 2.33% | 3.89% | 43.80% |
📌 Final Summary
The 1-year rolling return data gives us a simple picture of how DSP Small Cap Fund performed compared with the Nifty Smallcap 250 TRI.
- 🚀 Higher chance of big gains: DSP delivered returns above 20% in 50.05% of the periods, compared with 43.80% for the benchmark.
- 🛡️ Fewer negative periods: DSP had negative returns in 19.04% of the periods, while the benchmark had negative returns in 29.35%.
- 📉 Smaller worst fall: DSP’s worst 1-year return was -30.87%, compared with -41.65% for the benchmark.
- 📈 Higher average return: DSP delivered an average 1-year return of 27.47%, compared with 23.21% for the benchmark.
🎯 Final Takeaway
Based on the historical 1-year rolling return data, DSP Small Cap Fund performed better than the Nifty Smallcap 250 TRI in several important areas. It delivered higher average returns, achieved 20%+ returns more often, experienced fewer negative periods, and had a smaller worst-case fall.
📊 2-Year Rolling Return Statistics for DSP Small Cap
This table looks at what would happen if you invested your money and held onto it for 2 full years, comparing the DSP Small Cap Fund against the general market index (Nifty Smallcap 250 TRI).
Summary Statistics
| Scheme / Category Name | Average | Median | Maximum | Minimum |
| DSP Small Cap Fund – Direct Plan – Growth | 24.36% | 22.80% | 79.35% | -22.92% |
| Nifty Smallcap 250 TRI | 19.71% | 20.32% | 78.91% | -30.10% |
Return Distribution (% of Times)
This shows how frequently the investment hit different profit levels over a 2-year holding period:
| Scheme / Category Name | Less than 0% | 0 – 8% | 8 – 12% | 12 – 15% | 15 – 20% | Greater than 20% |
| DSP Small Cap Fund | 14.37% | 4.33% | 6.62% | 1.76% | 14.51% | 58.42% |
| Nifty Smallcap 250 TRI | 14.79% | 9.97% | 6.90% | 9.12% | 8.52% | 50.69% |
📝 Final Summary
Based on the 2-year rolling return data:
🚀 Big Gains: DSP gave more than 20% returns in 58.42% of the periods, compared with 50.69% for the Nifty.
📈 Average Return: DSP delivered an average return of 24.36%, higher than the Nifty’s 19.71%.
🛡️ Worst Fall: DSP’s worst 2-year fall was -22.92%, while the Nifty’s worst fall was -30.10%.
Final Takeaway
In very simple words, the 2-year data shows that DSP Small Cap Fund performed better than the Nifty in the period analyzed. It had a higher chance of delivering more than 20% returns and its worst fall was also smaller than the Nifty’s worst fall.
📊 3-Year Rolling Return Statistics for DSP Small Cap Fund
This table shows what would happen if you invested your money and held onto it for 3 full years, comparing the DSP Small Cap Fund against the general market index (Nifty Smallcap 250 TRI).
Summary Statistics
| Scheme / Category Name | Average | Median | Maximum | Minimum |
| DSP Small Cap Fund – Direct Plan – Growth | 22.28% | 23.43% | 56.90% | -12.78% |
| Nifty Smallcap 250 TRI | 18.17% | 20.47% | 44.66% | -17.52% |
Return Distribution (% of Times)
This shows how often the investment hit different profit levels over a 3-year holding period:
| Scheme / Category Name | Less than 0% | 0 – 8% | 8 – 12% | 12 – 15% | 15 – 20% | Greater than 20% |
| DSP Small Cap Fund | 7.36% | 11.91% | 6.32% | 2.62% | 9.56% | 62.22% |
| Nifty Smallcap 250 TRI | 11.59% | 10.17% | 5.20% | 3.58% | 17.84% | 51.62% |
📝 Final Summary
The 3-year rolling return analysis shows:
🚀 Big Gains: DSP earned more than 20% returns in 62.22% of the periods, compared with 51.62% for the Nifty.
🛡️ Fewer Losses: DSP had negative returns in only 7.36% of the periods, compared with 11.59% for the Nifty.
📉 Worst Fall: DSP’s worst 3-year return was -12.78%, while the Nifty’s worst was -17.52%.
📈 Average Return: DSP delivered an average 3-year return of 22.28%, compared with 18.17% for the Nifty.
Final Takeaway
In very simple words, the 3-year data shows that DSP Small Cap Fund performed better than the Nifty in the period analyzed. It had more periods with returns above 20%, fewer periods with losses, and a smaller worst-case decline.
This also shows why time can be an important friend for investors. When you stay invested for longer periods, the chances of ending with a loss may reduce. However, this does not guarantee profits, and small-cap funds can still experience large falls during difficult markets.
📊 5-Year Rolling Return Statistics for DSP Small Cap
This table shows what happens if you stay invested for a full 5 years, comparing the DSP Small Cap Fund against the general market index (Nifty Smallcap 250 TRI).
Summary Statistics
| Scheme / Category Name | Average | Median | Maximum | Minimum |
| DSP Small Cap Fund – Direct Plan – Growth | 20.16% | 19.14% | 37.70% | -0.28% |
| Nifty Smallcap 250 TRI | 16.52% | 16.01% | 40.05% | -5.83% |
Return Distribution (% of Times)
This shows how often the investment hit different profit levels over a 5-year holding period:
| Scheme / Category Name | Less than 0% | 0 – 8% | 8 – 12% | 12 – 15% | 15 – 20% | Greater than 20% |
| DSP Small Cap Fund | 0.29% | 5.85% | 13.75% | 13.37% | 19.98% | 46.76% |
| Nifty Smallcap 250 TRI | 3.19% | 21.31% | 9.90% | 12.42% | 16.08% | 37.11% |
📝 Final Summary
The 5-year rolling return analysis shows:
🛡️ Very Few Losses: DSP had negative returns in only 0.29% of the observed periods.
📉 Worst 5-Year Return: DSP’s worst result was -0.28%, compared with -5.83% for the Nifty.
🚀 Strong Growth: DSP delivered more than 20% returns in around 47% of the periods, compared with 37.11% for the Nifty.
📈 15%+ Returns: DSP delivered returns above 15% in around 67% of the observed periods.
🏆 Average Return: DSP delivered an average annualized return of 20.16%, compared with 16.52% for the Nifty.
Final Takeaway
In very simple words, the 5-year data shows that staying invested for a longer period helped reduce the chances of losing money in the historical periods studied. DSP Small Cap Fund also delivered strong average returns and had more periods with high returns compared with the Nifty.
📊 7-Year Rolling Return Statistics for DSP Small Cap
This table shows what happens if you stay invested for 7 long years, comparing the DSP Small Cap Fund against the general market index (Nifty Smallcap 250 TRI).
Summary Statistics
| Scheme / Category Name | Average | Median | Maximum | Minimum |
| DSP Small Cap Fund – Direct Plan – Growth | 18.77% | 18.41% | 24.85% | 14.27% |
| Nifty Smallcap 250 TRI | 14.81% | 14.53% | 21.35% | 5.78% |
Return Distribution (% of Times)
This shows how often the investment landed in different profit ranges over a 7-year holding period:
| Scheme / Category Name | Less than 0% | 0 – 8% | 8 – 12% | 12 – 15% | 15 – 20% | Greater than 20% |
| DSP Small Cap Fund | 0.00% | 0.00% | 0.00% | 2.17% | 65.03% | 32.80% |
| Nifty Smallcap 250 TRI | 0.00% | 3.04% | 9.81% | 43.60% | 40.62% | 2.92% |
📝 Final Summary
The 7-year rolling return analysis shows:
🛡️ Lowest 7-Year Return: DSP’s lowest annualized return was 14.27% in the historical data provided.
🌟 15%–20% Returns: DSP achieved returns in this range in 65.03% of the observed periods.
🚀 20%+ Returns: DSP delivered more than 20% annualized returns in 32.80% of the periods.
📈 15%+ Returns Overall: DSP delivered at least 15% annualized returns in 97.83% of the observed 7-year periods.
🏆 Average Return: DSP delivered an average annualized return of 18.77%, compared with 14.81% for the Nifty.
Final Takeaway
In very simple words, the 7-year data shows that DSP Small Cap Fund has performed strongly over long investment periods in the historical data provided. It delivered 15% or more annualized returns in almost all of the observed 7-year periods and had a higher average return than the Nifty.
📊 10-Year Rolling Return Statistics for DSP Small Cap Fund
This table shows what happens if you stay invested for a whole decade (10 full years), comparing the DSP Small Cap Fund against the general market index (Nifty Smallcap 250 TRI).
Summary Statistics
| Scheme / Category Name | Average | Median | Maximum | Minimum |
| DSP Small Cap Fund – Direct Plan – Growth | 20.92% | 21.17% | 27.68% | 15.21% |
| Nifty Smallcap 250 TRI | 17.01% | 16.32% | 21.80% | 12.83% |
Return Distribution (% of Times)
This shows how often the investment landed in different profit ranges over a 10-year holding period:
| Scheme / Category Name | Less than 0% | 0 – 8% | 8 – 12% | 12 – 15% | 15 – 20% | Greater than 20% |
| DSP Small Cap Fund | 0.00% | 0.00% | 0.00% | 0.00% | 46.84% | 53.16% |
| Nifty Smallcap 250 TRI | 0.00% | 0.00% | 0.00% | 14.71% | 69.43% | 15.86% |
📝 Final Summary
The 10-year rolling return analysis shows:
🛡️ Lowest 10-Year Return: DSP’s lowest annualized return was 15.21% in the historical data provided.
🚀 20%+ Returns: DSP delivered more than 20% annualized returns in 53.16% of the observed periods.
📊 Nifty Comparison: The Nifty delivered more than 20% annualized returns in 15.86% of the periods.
📈 Average Return: DSP delivered an average annualized return of 20.92%, compared with 17.01% for the Nifty.
Final Takeaway
In very simple words, the 10-year data shows that DSP Small Cap Fund has performed strongly over long periods in the historical data provided. It had a higher average return than the Nifty and delivered more than 20% annualized returns in more than half of the observed 10-year periods.
DSP Small Cap Fund Rolling Returns for Post January 2020
Here is the clear, structured breakdown of the 1-Year Rolling Returns post-January 2020, explained in simple terms that are easy for anyone (even a 10-year-old) to understand!
📊 1-Year Rolling Return Statistics (Post-Jan 2020) for DSP Small Cap Fund
This table shows how the DSP Small Cap Fund performed during the wild roller-coaster period after January 2020 (which includes the COVID-19 pandemic market crash and the massive recovery that followed), compared against the broader market index (Nifty Smallcap 250 TRI).
Summary Statistics
| Scheme / Category Name | Average | Median | Maximum | Minimum |
| DSP Small Cap Fund – Direct Plan – Growth | 30.52% | 26.72% | 119.14% | -6.10% |
| Nifty Smallcap 250 TRI | 31.94% | 26.31% | 135.79% | -11.87% |
Return Distribution (% of Times)
This shows how often the investment hit different profit or loss levels if you held it for 1 year at any point after January 2020:
| Scheme / Category Name | Less than 0% | 0 – 8% | 8 – 12% | 12 – 15% | 15 – 20% | Greater than 20% |
| DSP Small Cap Fund | 9.34% | 18.60% | 8.61% | 4.08% | 4.60% | 54.78% |
| Nifty Smallcap 250 TRI | 23.08% | 17.46% | 3.14% | 1.10% | 2.63% | 52.59% |
📝 Final Summary
The post-2020 1-year rolling return analysis shows:
🛡️ Fewer Losses: DSP had negative returns in 9.34% of the periods, compared with 23.08% for the Nifty.
📉 Smaller Worst Fall: DSP’s worst 1-year return was -6.10%, compared with -11.87% for the Nifty.
🚀 20%+ Returns: DSP delivered more than 20% returns in 54.78% of the periods, slightly higher than the Nifty’s 52.59%.
🌟 Highest Return: DSP recorded a maximum 1-year return of 119.14% in the data provided.
📈 Average Return: DSP averaged 30.52%, while the Nifty averaged 31.94%.
Final Takeaway
In very simple words, the post-2020 data shows that DSP Small Cap Fund had fewer negative 1-year periods and a smaller worst fall than the Nifty. It also delivered 20%+ returns slightly more often. However, the Nifty had a slightly higher average 1-year return during this period.
📊 2-Year Rolling Return Statistics (Post-Jan 2020) for DSP Small Cap
This table shows what happened if you held your investment for 2 full years anytime after January 2020, comparing DSP Small Cap Fund with the broader market index (Nifty Smallcap 250 TRI).
Summary Statistics
| Scheme / Category Name | Average | Median | Maximum | Minimum |
| DSP Small Cap Fund – Direct Plan – Growth | 26.72% | 23.68% | 73.91% | 5.55% |
| Nifty Smallcap 250 TRI | 26.92% | 26.62% | 78.91% | -1.16% |
Return Distribution (% of Times)
This shows how frequently the investment landed in different profit or loss ranges over any 2-year period after 2020:
| Scheme / Category Name | Less than 0% | 0 – 8% | 8 – 12% | 12 – 15% | 15 – 20% | Greater than 20% |
| DSP Small Cap Fund | 0.00% | 1.52% | 9.63% | 3.30% | 23.26% | 62.30% |
| Nifty Smallcap 250 TRI | 0.36% | 10.70% | 4.10% | 11.06% | 10.88% | 62.89% |
📝 Final Summary
The post-2020 2-year rolling return analysis shows:
🛡️ No Negative Periods: DSP had 0% negative 2-year periods in the data provided.
📈 Lowest Return: DSP’s lowest 2-year annualized return was 5.55%.
🚀 15%+ Returns: DSP delivered more than 15% annualized returns in over 85% of the observed periods.
🌟 20%+ Returns: DSP delivered more than 20% annualized returns in 62.30% of the periods.
🏆 Average Return: DSP averaged 26.72%, while the Nifty averaged 26.92%.
Final Takeaway
In very simple words, the post-2020 data shows that DSP Small Cap Fund performed strongly over 2-year periods. It did not have a negative 2-year period in the historical data provided and delivered more than 15% annualized returns in most of the periods studied.
📊 3-Year Rolling Return Statistics (Post-Jan 2020) for DSP Small Cap
This table shows what happened if you stayed invested for 3 full years at any point after January 2020, comparing the DSP Small Cap Fund with the broader market index (Nifty Smallcap 250 TRI).
Summary Statistics
| Scheme / Category Name | Average | Median | Maximum | Minimum |
| DSP Small Cap Fund – Direct Plan – Growth | 26.39% | 24.96% | 44.61% | 12.83% |
| Nifty Smallcap 250 TRI | 26.95% | 25.42% | 44.66% | 13.74% |
Return Distribution (% of Times)
This shows how often the investment landed in different profit ranges over a 3-year holding period after 2020:
| Scheme / Category Name | Less than 0% | 0 – 8% | 8 – 12% | 12 – 15% | 15 – 20% | Greater than 20% |
| DSP Small Cap Fund | 0.00% | 0.00% | 0.00% | 1.37% | 15.95% | 82.69% |
| Nifty Smallcap 250 TRI | 0.00% | 0.00% | 0.00% | 0.34% | 15.72% | 83.94% |
📝 Final Summary
The post-2020 3-year rolling return analysis shows:
🛡️ Lowest DSP Return: DSP’s lowest 3-year annualized return was 12.83% in the historical data provided.
🚀 20%+ Returns: DSP delivered more than 20% annualized returns in 82.69% of the periods, compared with 83.94% for the Nifty.
🌟 15%+ Returns: DSP delivered more than 15% annualized returns in 98.64% of the observed periods.
📈 Average Return: DSP averaged 26.39%, while the Nifty averaged 26.95%.
Final Takeaway
In very simple words, the post-2020 data shows that DSP Small Cap Fund performed strongly over 3-year periods. In the historical periods studied, its lowest annualized return was 12.83%, and it delivered more than 15% annualized returns in almost all observed periods.
📊 5-Year Rolling Return Statistics (Post-Jan 2020) for DSP Small Cap
This table shows what happened if you stayed invested for 5 full years at any point after January 2020, comparing the DSP Small Cap Fund with the broader market index (Nifty Smallcap 250 TRI).
Summary Statistics
| Scheme / Category Name | Average | Median | Maximum | Minimum |
| DSP Small Cap Fund – Direct Plan – Growth | 26.41% | 26.80% | 37.70% | 18.02% |
| Nifty Smallcap 250 TRI | 26.25% | 26.56% | 40.05% | 15.49% |
Return Distribution (% of Times)
This shows how often the investment landed in different profit ranges over a 5-year holding period after 2020:
| Scheme / Category Name | Less than 0% | 0 – 8% | 8 – 12% | 12 – 15% | 15 – 20% | Greater than 20% |
| DSP Small Cap Fund | 0.00% | 0.00% | 0.00% | 0.00% | 18.75% | 81.25% |
| Nifty Smallcap 250 TRI | 0.00% | 0.00% | 0.00% | 0.00% | 26.82% | 73.18% |
📝 Final Summary
The post-2020 5-year rolling return analysis shows:
🛡️ Lowest Return: DSP’s lowest 5-year annualized return was 18.02% in the historical data provided.
📈 Nifty’s Lowest Return: The Nifty’s lowest 5-year annualized return was 15.49%.
🚀 20%+ Returns: DSP delivered more than 20% annualized returns in 81.25% of the periods, compared with 73.18% for the Nifty.
🏆 Average Return: DSP averaged 26.41%, while the Nifty averaged 26.25%.
Final Takeaway
In very simple words, the post-2020 5-year data shows that DSP Small Cap Fund performed strongly over long periods. In the historical periods studied, its lowest 5-year annualized return was 18.02%, and it delivered more than 20% annualized returns in more than 80% of the observed periods.
📊 DSP Small Cap Fund – Benchmark Outperformance Ratio (BOR) Analysis
| Rolling Period | Total Cycles / Observations | Outperformed by Benchmark (Times) | Underperformed Benchmark (Times) | BOR (%) |
| 1 Year | 3,089 | 2,109 | 980 | 68.27% |
| 2 Years | 2,840 | 1,957 | 883 | 68.90% |
| 3 Years | 2,594 | 1,894 | 700 | 73.00% |
| 5 Years | 2,120 | 2,016 | 104 | 95.00% |
| 7 Years | 1,610 | 1,610 | 0 | 100.00% |
| 10 Years | 869 | 869 | 0 | 100.00% |
⭐ Simple Overall Takeaway
The BOR data gives a clear message: Edelweiss Small Cap Fund has shown stronger benchmark outperformance as the investment period became longer.
In the shorter 1-year and 2-year periods, the fund beat the benchmark around 68–69% of the time. This improved to 73% over 3 years, 95% over 5 years, and 100% over both 7-year and 10-year periods.
In simple words, the fund’s performance appears to have been more consistent when investors stayed invested for a longer period. However, a high BOR is only one part of the analysis. New investors should also look at CAGR, rolling returns, risk, maximum drawdown, portfolio quality, expense ratio, and fund manager strategy before making an investment decision.
📊 DSP Small Cap Fund – Benchmark Outperformance Ratio (BOR) Analysis
DSP Small Cap Fund Rolling Returns & Benchmark Outperformance After January 2020
| Rolling Period | Total Cycles / Observations | Outperformed by Benchmark (Times) | Underperformed Benchmark (Times) | BOR (%) |
| 1 Year | 1,371 | 826 | 545 | 60% |
| 2 Years | 1,122 | 535 | 587 | 48% |
| 3 Years | 878 | 192 | 686 | 22% |
| 5 Years | 384 | 296 | 88 | 77% |
📊 What Does the BOR Data Tell Us?
The Benchmark Outperformance Ratio (BOR) shows how often DSP Small Cap Fund performed better than its benchmark during different rolling investment periods. Let’s look at the results in a simple way.
🟢 1-Year Rolling Period
DSP Small Cap Fund beat its benchmark in 826 out of 1,371 periods, giving it a 60% BOR.
Simple meaning: Out of every 10 rolling 1-year periods, DSP performed better than the benchmark roughly 6 times. This shows decent short-term outperformance, but the fund still underperformed in many periods.
🟡 2-Year Rolling Period
Over 2-year rolling periods, DSP outperformed the benchmark 535 times, while it underperformed 587 times. This resulted in a 48% BOR.
Simple meaning: The fund beat the benchmark in fewer than half of the periods. So, during this period, DSP did not show consistent benchmark-beating performance.
🔴 3-Year Rolling Period
The 3-year results were the weakest among the periods studied.
DSP beat the benchmark only 192 times out of 878 periods, resulting in a BOR of just 22%.
Simple meaning: The fund beat its benchmark only about 2 out of every 10 times. This indicates that DSP struggled to consistently stay ahead of the benchmark during 3-year rolling periods after January 2020.
🟢 5-Year Rolling Period
The picture changed significantly when we looked at 5-year rolling periods.
DSP outperformed the benchmark 296 times out of 384 periods, giving it a strong 77% BOR.
Simple meaning: Around 8 out of every 10 rolling 5-year periods showed DSP beating its benchmark. This suggests that the fund’s performance looked much stronger when investors stayed invested for longer periods.
🔍 Key Observation
The BOR data gives us a mixed picture of DSP Small Cap Fund’s performance after January 2020.
The fund performed reasonably well over 1-year periods, with a 60% BOR. However, its performance became weaker over 2-year periods and especially over 3-year periods, where the BOR dropped to just 22%.
But the story changed dramatically over the 5-year period, where the BOR increased to 77%.
This may suggest that the fund’s investment strategy needed more time to show its results. Short-term market movements can affect small-cap funds heavily, while a longer investment period may give the fund manager more time for stock selections to perform.
🎯 Simple Conclusion
Think of DSP Small Cap Fund like a cricket player. Sometimes the player scores well in short matches, sometimes the performance is average, and sometimes the player struggles. But when we look at a longer series, the overall performance can look much better.
Based on the data provided:
- 1 Year: 🟢 Good – 60% BOR
- 2 Years: 🟡 Mixed – 48% BOR
- 3 Years: 🔴 Weak – 22% BOR
- 5 Years: 🟢 Strong – 77% BOR
The main lesson: DSP Small Cap Fund has not consistently beaten its benchmark across every period after 2020. Its 3-year rolling performance was particularly weak, but its 5-year results were much stronger.
For investors, this shows why it is important to look at long-term performance instead of judging a small-cap fund only by its recent returns. At the same time, a strong 3 & 5-year BOR does mean the fund will always outperform in the future.
DSP Small Cap Fund Comprehensive Risk Profile Analysis
ere is the complete breakdown of the 3-Year Risk & Return Analysis statistics, explained in simple terms that are easy for anyone (even a 10-year-old) to understand!
📊 3-Year Risk & Return Analysis Table for DSP Small Cap Fund
| Risk & Volatility Measure | Investment (DSP) | Category Average | Index (Benchmark) |
| Alpha | 1.11 | 0.17 | 0.68 |
| Beta | 0.92 | 0.86 | 0.85 |
| R² (R-Squared) | 90.70 | 92.03 | 91.77 |
| Sharpe Ratio | 0.66 | 0.62 | 0.64 |
| Standard Deviation | 21.37% | 19.79% | 19.88% |
Market Volatility Measures
| Measure | Investment (DSP) | Category Average | Index (Benchmark) |
| Upside Capture Ratio | 93 | 86 | 85 |
| Downside Capture Ratio | 86 | 81 | 80 |
| Maximum Drawdown (%) | -21.63% | -22.61% | -18.62% |
🎮 What Do These Numbers Mean? (Super Simple Explanation)
eturns are not the only thing we should look at when choosing a mutual fund. We should also understand how much the fund can go up and down.
1. Alpha (1.11) – Extra Performance ⭐
Alpha tells us whether the fund manager was able to earn extra returns compared with the benchmark.
DSP Small Cap Fund has an Alpha of 1.11, while the category average is 0.17.
This is a positive sign. It means the fund manager’s stock choices have helped the fund earn better returns than expected.
2. Beta (0.92) – How Much Does the Fund Move? 🎢
Beta tells us how much the fund moves when the market moves.
A Beta of 1 means the fund moves about the same as the market.
DSP has a Beta of 0.92. So, if the market moves by 10%, DSP may move by about 9.2%.
In simple words, the fund has moved slightly less than the benchmark.
3. R² (90.70%) – How Closely Does It Follow the Market? 🎯
R² tells us how closely the fund’s movements match its benchmark.
DSP has an R² of 90.70%. This means most of the fund’s movements are connected to the benchmark, while some performance comes from the fund manager’s own stock choices.
4. Sharpe Ratio (0.66) – Is the Return Worth the Risk? 🏆
The Sharpe Ratio tells us how much return the fund gives for the risk it takes.
DSP has a Sharpe Ratio of 0.66, compared with 0.62 for the category.
A higher number is usually better. This means DSP has given slightly better returns for the risk taken compared with the category average.
5. Standard Deviation (21.37%) – How Bumpy Is the Ride? 🌊
Standard Deviation tells us how much the fund’s returns can jump up and down.
DSP has a Standard Deviation of 21.37%, while the category average is 19.79%.
This means DSP can be a little more bumpy or volatile than the average small-cap fund.
How Does the Fund Perform When the Market Goes Up or Down?
Upside Capture Ratio (93) – Performance in Good Markets 🎈
This tells us how well the fund performs when the market is going up.
DSP has an Upside Capture Ratio of 93, compared with 86 for the category.
This means DSP has captured a good share of the market’s gains when the market was rising.
Downside Capture Ratio (86) – Performance in Bad Markets 🛡️
This tells us how much the fund falls when the market is going down.
A lower number is usually better because it means the fund falls less.
DSP has a Downside Capture Ratio of 86, while the category average is 81.
This means DSP has fallen more than the average category fund during market declines.
Maximum Drawdown – The Biggest Fall 📉
Maximum Drawdown shows the biggest fall the fund experienced from its highest point to its lowest point during a period.
DSP’s Maximum Drawdown was around -21.63%, while the category average was -22.61%.
For example, imagine you invested ₹1,00,000.
If the fund falls by 22%, your money may temporarily become about ₹78,000.
If the benchmark falls by only 18% during the same period, ₹1,00,000 invested in the benchmark may become about ₹82,000.
This shows that the fund can sometimes fall significantly during bad markets. However, a fall is not a permanent loss if the fund later recovers.
📊 5-Year Risk & Return Analysis Table for DSP Small Cap Fund
| Risk & Volatility Measure | Investment (DSP) | Category Average | Index (Benchmark) |
| Alpha | 3.07 | 2.21 | 2.33 |
| Beta | 0.90 | 0.82 | 0.83 |
| R² (R-Squared) | 91.51 | 89.60 | 89.86 |
| Sharpe Ratio | 0.72 | 0.68 | 0.68 |
| Standard Deviation | 19.24% | 17.83% | 18.00% |
Market Volatility Measures
| Measure | Investment (DSP) | Category Average | Index (Benchmark) |
| Upside Capture Ratio | 93 | 85 | 86 |
| Downside Capture Ratio | 78 | 72 | 70 |
| Maximum Drawdown (%) | -21.63% | -22.61% | -18.62% |
🎮 What Do These Numbers Mean over 5 Years? (Super Simple Story)
1. Alpha (3.07) – Extra Performance ⭐
Alpha tells us how much extra return the fund earned through its investment decisions compared with the benchmark.
DSP has an Alpha of 3.07, while the category average is 2.21 and the index is 2.33.
This is a positive sign. It means the fund’s investment decisions helped it earn extra returns above the benchmark.
In simple words: The fund manager made some good investment choices that added extra returns.
2. Beta (0.90) – How Much Does the Fund Move? 🎢
Beta tells us how much the fund moves when the market moves.
A Beta of 1.00 means the fund moves almost the same as the market.
DSP has a Beta of 0.90.
So, if the market moves up or down by 10%, DSP may move by around 9%, based on this measure.
In simple words: DSP has generally moved a little less than the benchmark.
3. R² (91.51%) – How Closely Does It Follow the Market? 🎯
R² tells us how closely the fund’s movements are connected to its benchmark.
DSP has an R² of 91.51%.
This means most of the fund’s movements are linked to the benchmark, while the remaining performance can come from the fund’s own stock selections.
In simple words: DSP mostly moves with the small-cap market but still has some differences because of the stocks it chooses.
4. Sharpe Ratio (0.72) – Is the Return Worth the Risk? 🏆
The Sharpe Ratio helps us understand whether the fund earned a good return for the amount of risk it took.
DSP has a Sharpe Ratio of 0.72, compared with 0.68 for the category.
A higher number is generally better.
In simple words: DSP has given a slightly better reward for the risk taken compared with the average small-cap fund.
5. Standard Deviation (19.24%) – How Bumpy Is the Ride? 🌊
Standard Deviation shows how much the fund’s returns move up and down.
DSP has a 5-year Standard Deviation of 19.24%, compared with 17.83% for the category.
This means DSP has been slightly more volatile than the average small-cap fund.
However, its 5-year volatility is lower than the 21.37% seen over the 3-year period.
In simple words: The fund’s ride has become a little smoother when we look at a longer 5-year period.
How Did DSP Perform When the Market Went Up and Down?
Upside Capture Ratio (93) – Performance in Good Markets 🎈
The Upside Capture Ratio tells us how well the fund performed when the benchmark was rising.
DSP has an Upside Capture Ratio of 93, compared with 85 for the category.
In simple words: When the market went up, DSP captured a large part of those gains and performed better than the average category fund.
Downside Capture Ratio (78) – Performance in Bad Markets 🛡️
The Downside Capture Ratio shows how much of the market’s fall the fund experienced when the market went down.
A lower number is generally better.
DSP has a Downside Capture Ratio of 78, compared with 72 for the category.
This means DSP experienced about 78% of the benchmark’s decline during falling markets.
In simple words: DSP did not completely avoid market falls, but it did not capture the full fall either.
Maximum Drawdown – The Biggest Fall 📉
Maximum Drawdown shows the biggest fall the fund experienced from its highest value to its lowest value during the period.
DSP’s reported Maximum Drawdown was -21.63%, while the category average was -22.61%.
However, investors should remember that a fund can sometimes fall more than its benchmark during a particular market correction.
For example: Imagine you invested ₹1,00,000.
- If DSP falls by 22%, your investment could temporarily fall to ₹78,000.
- If the benchmark falls by only 18% during the same period, ₹1,00,000 invested in the benchmark could fall to ₹82,000.
In this situation, DSP would have fallen more than the benchmark by 4 percentage points.
This is why investors should not look only at returns. It is also important to check how much the fund falls during bad markets and how quickly it recovers afterward.
📊 DSP Small Cap Fund – 10-Year Risk Analysis in Simple Words
| Risk & Volatility Measure | Investment (DSP) | Category Average | Index (Benchmark) |
| Alpha | 2.52 | 2.86 | 2.41 |
| Beta | 0.88 | 0.84 | 0.84 |
| R² (R-Squared) | 94.24 | 90.99 | 90.82 |
| Sharpe Ratio | 0.59 | 0.61 | 0.58 |
| Standard Deviation | 21.67% | 20.98% | 21.12% |
Market Volatility Measures
| Measure | Investment (DSP) | Category Average | Index (Benchmark) |
| Upside Capture Ratio | 91 | 88 | 90 |
| Downside Capture Ratio | 80 | 75 | 75 |
| Maximum Drawdown (%) | -44.20% | -41.53% | -27.88% |
🎮 What Do These Numbers Mean over 10 Years? (Super Simple Story)
Looking at 10 years of data helps us understand how DSP Small Cap Fund behaved over a very long period. This period includes both good markets and difficult market crashes.
1. Alpha (2.52) – Extra Returns ⭐
Alpha tells us how much extra return the fund generated through its investment decisions compared with the benchmark.
DSP has an Alpha of 2.52, while the index has an Alpha of 2.41.
2. Beta (0.88) – How Much Does the Fund Move? 🎢
Beta shows how much the fund moves when the market moves.
A Beta of 1.00 means the fund moves almost the same as the market.
DSP has a Beta of 0.88.
So, if the market moves by 10%, DSP may move by around 8.8%, based on this measure.
In simple words: DSP has generally moved a little less than the overall market.
3. R² (94.24%) – How Closely Does It Follow the Market? 🎯
R² tells us how closely the fund’s movements are connected to its benchmark.
DSP has an R² of 94.24%, which is a very high level.
This means most of the fund’s movements have been closely linked to the broader small-cap market.
In simple words: DSP usually moves in the same direction as the small-cap market, although its own stock choices can still make a difference.
4. Sharpe Ratio (0.59) – Is the Return Worth the Risk? 🏆
The Sharpe Ratio helps us understand whether the fund has given a good return for the risk taken.
DSP has a Sharpe Ratio of 0.59, compared with 0.58 for the index.
A higher Sharpe Ratio is generally better.
In simple words: Over the last 10 years, DSP has provided slightly better returns for the amount of risk taken compared with the index.
5. Standard Deviation (21.67%) – How Bumpy Is the Ride? 🌊
Standard Deviation tells us how much the fund’s returns move up and down.
DSP has a Standard Deviation of 21.67%, compared with 21.12% for the index.
The numbers are quite close.
In simple words: DSP has experienced a similar level of ups and downs as the overall market over the 10-year period.
How Did DSP Perform When the Market Went Up and Down?
Upside Capture Ratio (91) – Performance in Good Markets 🎈
The Upside Capture Ratio shows how well the fund performs when the benchmark is rising.
DSP has an Upside Capture Ratio of 91, compared with 88 for the category and 90 for the index.
In simple words: When the market was doing well, DSP captured a large part of the market’s gains.
Downside Capture Ratio (80) – Performance in Bad Markets 🛡️
The Downside Capture Ratio tells us how much of the market’s fall the fund experienced when the market went down.
A lower number is usually better because it means the fund falls less.
DSP has a Downside Capture Ratio of 80.
In simple words: When the market went down, DSP still fell, but it captured around 80% of the market’s decline.
This shows that the fund did not completely protect investors from falling markets, but it also did not experience the full decline in every market fall.
Maximum Drawdown – The Biggest Fall 📉
Maximum Drawdown shows the biggest fall from the fund’s highest point to its lowest point during the 10-year period.
DSP recorded a maximum drawdown of around -44.20%.
This means that during the worst period, the fund could have lost nearly 44% of its value temporarily before recovering.
Simple Example
Imagine you invested ₹1,00,000.
During a very bad market period:
- DSP Small Cap Fund falls 44% → ₹1,00,000 could become about ₹56,000.
- Benchmark falls 28% → ₹1,00,000 could become about ₹72,000.
- Index falls 41% → ₹1,00,000 could become about ₹59,000.
This example shows that DSP could fall much more than the benchmark and even more than the index during a particular worst-case period.
So, even though DSP has delivered strong long-term performance, investors should understand that small-cap funds can experience very large temporary losses during severe market crashes.
DSP Small Cap Fund – Best & Worst Quarterly Returns
📊 A quarter means 3 months. During these 3 months, a mutual fund can make a big profit or face a big loss. This is especially true for small-cap funds because their prices can move up and down quickly.
Best Quarterly Returns
| Period | Fund (%) | Category Average (%) |
| Q2-2020 | 25.23% | 21.71% |
| Q2-2026 | 24.85% | 24.61% |
| Q3-2020 | 23.26% | 22.93% |
Worst Quarterly Returns
| Period | Fund (%) | Category Average (%) |
| Q1-2020 | -26.67% | -27.25% |
| Q1-2025 | -15.13% | -13.65% |
| Q1-2018 | -11.86% | -8.1 |
📊 Summary: DSP Small Cap Fund – Best & Worst Quarterly Returns
The quarterly return data shows that DSP Small Cap Fund can experience both strong growth and sharp falls over short periods. This is normal for small-cap funds, where stock prices can move quickly.
🚀 Best Performance: The fund’s strongest quarter was Q2 2020, when it gained 25.23%, beating the category average of 21.71%. It also delivered strong returns of 24.85% in Q2 2026 and 23.26% in Q3 2020, performing slightly better than the category average in both periods.
📉 Worst Performance: The fund’s biggest quarterly fall was in Q1 2020, when it dropped 26.67%. However, this was slightly better than the category’s 27.25% decline. The fund also fell 15.13% in Q1 2025 and 11.86% in Q1 2018.
🎯 Final Takeaway
The data shows that DSP Small Cap Fund can deliver powerful returns when markets recover, but it can also face significant short-term losses during difficult market conditions. Its best quarterly gains were above 23%, while its worst fall was around 27%.
Simple lesson: Small-cap funds are like a roller coaster—there can be exciting upward moves and scary drops. Investors should have a long-term mindset and be prepared for short-term ups and downs rather than judging the fund based on a single quarter.
📊 DSP Small Cap Fund – Portfolio Allocation Details
1. Portfolio – Asset Allocation
| Asset Class | Allocation (%) |
| Equity | 88.70% |
| Debt | 0.00% |
| Cash | 11.30% |
| Derivatives | 0.00% |
2. Portfolio – Weightage by Market Cap
| Market Cap Category | Allocation (%) |
| Large Cap | 0.00% |
| Mid Cap | 5.28% |
| Small Cap | 88.70% |
| Others | 6.02% |
3. Portfolio – Concentration
| Concentration Measure | Value |
| No. of Stocks | 83 |
| Average Market Cap | ₹12,123.53 Cr |
| Top 10 Stocks | 28.61% |
| Top 5 Stocks | 18.42% |
| Top 3 Sectors | 63.26% |
🍕 DSP Small Cap Fund Portfolio – Explained Like a Pizza
Imagine the entire DSP Small Cap Fund is a 100-piece pizza. The fund manager decides how to divide those 100 pieces among different types of investments. This helps us understand where your money is actually going.
💰 1. Where Does the Money Go?
Out of every 100 pieces:
- 88.70 pieces → Equity: Most of the money is invested in company shares. Since this is a small-cap fund, the focus is mainly on smaller businesses that could grow over many years.
- 11.30 pieces → Cash: The fund keeps some money in cash instead of investing everything. This gives the fund manager flexibility to invest when attractive opportunities appear.
Simple example: Think of keeping some money in your pocket while shopping. You don’t spend everything at once. If you find something valuable at a lower price later, you still have money available to buy it.
🏢 2. What Type of Companies Does It Buy?
The fund mainly focuses on smaller companies.
- 88.70% → Small-cap companies: This is the main focus of the fund. These companies may have greater growth potential, but they can also be more risky and their share prices can move up and down sharply.
- 5.28% → Mid-cap companies: A small portion is invested in medium-sized companies.
- 0% → Large-cap companies: Based on the provided portfolio data, the fund has no allocation to large-cap companies.
Simple meaning: If you are investing in this fund, you are mainly investing in the small-company segment of the stock market. This can offer higher growth opportunities but also comes with higher risk.
🧺 3. Is the Money Spread Across Many Companies?
Yes. The portfolio contains around 83 stocks.
Imagine you have 83 different baskets instead of putting all your eggs into one basket. If one company performs badly, it may not affect the entire portfolio as much because your money is spread across many businesses.
- Top 5 stocks → 18.42%
- Top 10 stocks → 28.61%
This means the fund is not heavily dependent on just a few companies. The top 10 stocks together make up less than one-third of the portfolio.
However, the top 3 sectors account for 63.26% of the portfolio. This means that while the fund is spread across many individual companies, a large portion of the money is still concentrated in three major industries.
🏁 Final Verdict on DSP Small Cap Fund
After checking all the important numbers—CAGR, rolling returns, BOR, risk ratios, maximum fall, quarterly returns, and portfolio details—DSP Small Cap Fund gives us a mixed picture.
🌟 A Good Long-Term History
If we look at the fund’s long-term 10-year performance, DSP Small Cap Fund has done well. It has given good returns, created wealth for investors, and performed better than its benchmark over the long period based on the data we studied.
Its positive Alpha also shows that the fund manager’s stock selection has added value in the periods analyzed.
So, if we look only at the long-term history, DSP Small Cap Fund looks like a strong fund.
⚠️ But Recent Performance Needs Attention
The story changes when we look at the fund’s performance after January 2020.
The BOR (Benchmark Outperformance Ratio) tells us how often the fund beat its benchmark.
- 1-year BOR: 60% → The fund beat the benchmark 6 out of 10 times.
- 2-year BOR: 48% → The fund beat the benchmark less than half the time.
- 3-year BOR: 22% → The fund beat the benchmark only about 2 out of 10 times.
- 5-year BOR: 77% → The fund performed much better over longer periods.
This tells us that DSP Small Cap Fund has not been a consistent benchmark-beater in recent years, especially when we look at the 2-year and 3-year rolling periods.
📊 What About Investors Who Started 2–3 Years Ago?
If someone invested in DSP Small Cap Fund around 2 or 3 years ago, the fund’s recent performance compared with the benchmark needs to be watched carefully.
The rolling return data shows that the fund was behind its benchmark in many 2-year and 3-year periods. This does not mean the fund is bad or that it will always underperform. However, it is an important point for investors to consider.
⚠️ Disclaimer
This article is provided only for educational and research purposes. It is not investment advice or a recommendation to buy, sell, or continue investing in DSP Small Cap Fund.
Past performance does not guarantee future returns. Mutual fund investments are subject to market risks, and small-cap funds can be highly volatile. Before investing, please do your own research and consider consulting a SEBI-registered investment adviser or qualified financial professional based on your financial goals and risk tolerance.
Frequently Asked Questions (FAQs)
1. Is DSP Small Cap Fund a good fund?
DSP Small Cap Fund has a strong long-term historical track record. However, its rolling returns and BOR data after 2020 show weaker consistency against the benchmark. Investors should compare it with other small-cap funds before making an investment decision.
2. Did DSP Small Cap Fund outperform its benchmark in the past?
Yes. Based on the CAGR data provided, the fund has outperformed the BSE 250 SmallCap TRI over several long-term periods, including 3-year, 5-year, 7-year, and 10-year periods.
3. How has DSP Small Cap Fund performed after 2020?
The performance after 2020 has been mixed. The fund has not consistently beaten its benchmark across all rolling periods. The 3-year rolling BOR was particularly weak at 22%, showing that the fund outperformed the benchmark in only 22% of the observed 3-year periods.
4. What is the BOR of DSP Small Cap Fund after 2020?
Based on the data provided, the BOR was:
- 1-Year: 60%
- 2-Year: 48%
- 3-Year: 22%
- 5-Year: 77%
The 3-year BOR is the weakest, while the 5-year BOR is much stronger.
5. What does a 22% 3-year BOR mean?
A 22% BOR means DSP Small Cap Fund outperformed its benchmark in only about 22 out of every 100 observed 3-year rolling periods. This indicates weak consistency in beating the benchmark over 3-year periods after 2020.
6. Does DSP Small Cap Fund have good long-term returns?
Yes, based on the CAGR data provided, the fund has delivered competitive long-term returns and has outperformed its benchmark over several longer periods. However, investors should not look at CAGR alone and should also check rolling returns and risk metrics.
7. Is DSP Small Cap Fund risky?
Yes. Like other small-cap funds, DSP Small Cap Fund carries a high level of risk and volatility. Its Standard Deviation and Maximum Drawdown figures show that investors should be prepared for significant temporary declines.
8. Should I invest in DSP Small Cap Fund now?
This analysis does not recommend whether you should invest or not. If you are considering investing in a small-cap fund, it may be useful to compare DSP with other funds in the category using metrics such as CAGR, rolling returns, BOR, Alpha, Sharpe Ratio, Maximum Drawdown, and downside capture.
9. Is a low BOR always a reason to avoid a fund?
Not necessarily. A low BOR is one factor to consider. Investors should also look at the investment period, fund strategy, risk level, portfolio quality, fund manager changes, and long-term performance before reaching a conclusion.
10. What is the biggest concern with DSP Small Cap Fund based on this analysis?
The main concern is recent consistency against the benchmark. While the fund has a strong long-term historical record, its post-2020 rolling return analysis shows that it struggled to consistently outperform the benchmark over 2-year and 3-year periods.
11. Can DSP Small Cap Fund perform better in the future?
Yes, it is possible. Past underperformance does not mean the fund will always underperform. The fund’s future performance will depend on its portfolio holdings, fund management, market conditions, and the performance of small-cap companies.
Disclaimer: Mutual fund investments are subject to market risks. Please read all scheme-related documents carefully before investing. Historical performance data does not guarantee future returns
Nice work