

A comprehensive, data-driven Axis Small Cap Fund review for 2026. Evaluate CAGR returns, rolling returns analysis, Benchmark Outperformance Ratio (BOR), risk metrics (Alpha, Beta, Sharpe), and fund manager changes to make an informed investment decision.
Table of Contents
- Introduction
- Axis Small Cap Fund Overview
- Returns Analysis
- Rolling Returns Analysis
- Benchmark Outperformance Ratio (BOR)
- Risk Analysis
- Expense Ratio
- Assets Under Management (AUM)
- Fund Manager Analysis
- Strengths
- Weaknesses
- Who Should Invest?
- Who Should Avoid?
- Final Verdict
- FAQs
- Conclusion
1. Introduction
The Indian equity landscape in mid-2026 presents a fascinating study in market dynamics. Following the monumental bull runs of the post-pandemic era and subsequent structural valuation corrections, small-cap stocks have transitioned from a phase of speculative momentum to one requiring strict fundamental selection. In an environment where systemic liquidity is no longer a guaranteed rising tide for all boats, retail and institutional investors alike are searching for active equity managers capable of insulating capital during downward shifts while participating reliably in growth upcycles.
Within this macro environment, evaluating a premier vehicle like the Axis Small Cap Fund Direct Growth plan requires moving past simple point-to-point historical returns. Historically celebrated as the definitive “defensive fortress” of the small-cap mutual fund category, this scheme has drawn massive capital inflows. However, its expanding scale presents structural changes.
This comprehensive Axis Small Cap Fund Review 2026 provides an analytical assessment of the fund’s architectural design, underlying performance metrics, and risk management systems. By using deep statistical frameworks—including rolling return profiles, risk capture ratios, and the proprietary Benchmark Outperformance Ratio (BOR)—this investment report uncovers whether the fund remains a top choice in Small Cap Mutual Fund 2026 line-ups or if its expanding size has impacted its market-beating edge.
2. Axis Small Cap Fund Overview
The Axis Small Cap Fund was launched in November 2013, entering the Indian mutual fund landscape at a time when small-cap investing was widely regarded as a high-risk, speculative endeavor. Over its approximately 12.5-year operational journey, the fund has been instrumental in reshaping investor perceptions, proving that a disciplined, institutional approach can effectively manage the inherent volatility of smaller enterprises.
The fund operates under a clear, non-negotiable regulatory and internal mandate: it must allocate a minimum of 65% of its total equity assets to small-cap companies, defined by the Association of Mutual Funds in India (AMFI) as those ranking from the 251st company onward in terms of full market capitalization.
What sets the Axis investment philosophy apart from purely momentum-driven small-cap peers is its focus on a bottom-up, quality-first selection framework. The core philosophy is built around “Growth at a Reasonable Price” (GARP). Rather than chasing micro-cap stocks during speculative market cycles, the fund targets companies with clear competitive advantages, clean corporate governance records, strong institutional ownership, and resilient free cash flow cycles. This systematic layout forms the baseline for our detailed Small Cap Fund Review and Mutual Fund Analysis.
3. Returns Analysis
Evaluating performance requires examining both short-term momentum shifts and long-term wealth compounding cycles. This dual perspective reveals how a fund navigates different market environments.
A. Short-Term Performance
Short-term data highlights immediate fund momentum and shows how the portfolio responds to sudden changes in market cycles.
| Fund / Period | YTD (%) | 1D (%) | 1M (%) | 3M (%) | 6M (%) |
| Axis Small Cap Dir | 6.93% | -0.57% | 3.74% | 15.83% | 6.41% |
| BSE 250 SmallCap TRI | 6.24% | 0.20% | 5.85% | 22.78% | 6.20% |
| Equity: Small Cap Category | 8.21% | -0.49% | 4.31% | 19.08% | 8.09% |
B. Long-Term CAGR Returns
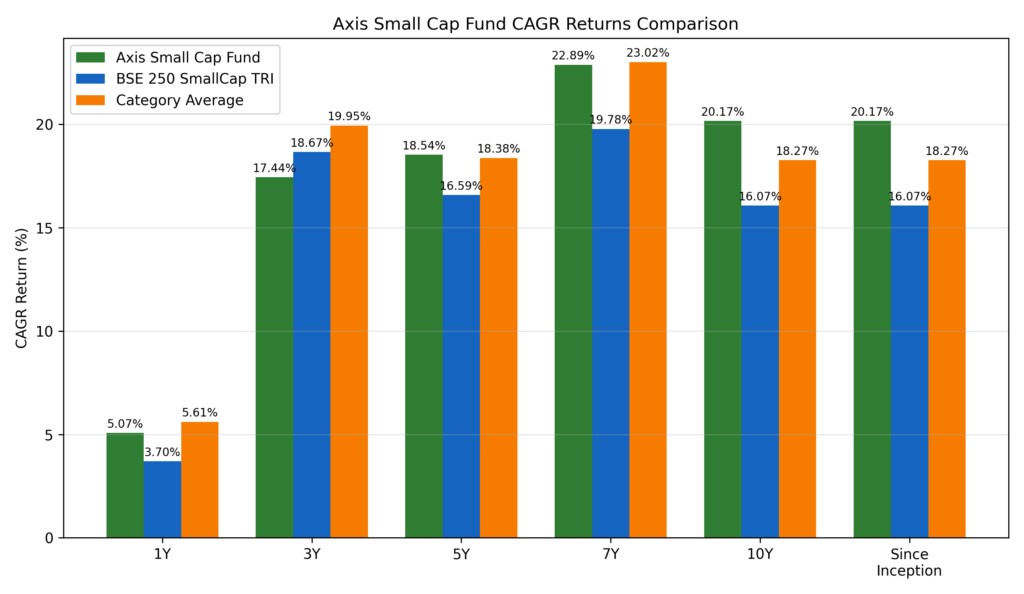
Long-term CAGR Returns smooth out short-term market noise, offering a clearer look at a fund’s structural wealth-generation capabilities.
| Fund / Period | 1Y (%) | 3Y (%) | 5Y (%) | 7Y (%) | 10Y (%) | Since Inception CAGR (%) |
| Axis Small Cap Dir | 5.07% | 17.44% | 18.54% | 22.89% | 20.17% | 20.17% |
| BSE 250 SmallCap TRI | 3.70% | 18.67% | 16.59% | 19.78% | 16.07% | 16.07% |
| Equity: Small Cap Category | 5.61% | 19.95% | 18.38% | 23.02% | 18.27% | 18.27% |
Peer Group Ranking & Quartile Performance
| Period | 1Y | 3Y | 5Y | 7Y | 10Y | Since Inception |
| Rank within Category | 22 | 26 | 13 | 8 | 2 | 2 |
| Number of Funds in Category | 46 | 33 | 25 | 19 | 12 | 12 |
4. Axis Small Cap Fund Rolling Returns
While trailing returns provide a simple snapshot of history, they can be distorted by point-to-point date selection bias. To evaluate a fund’s true performance consistency, we use a comprehensive Rolling Returns Analysis. This methodology tracks every possible investment window across the fund’s lifecycle, evaluating performance across multiple market cycles.
A. Rolling Returns (From Fund Inception to As-on Date)
This historical view charts performance over the fund’s entire operating history, capturing wealth creation across diverse macroeconomic environments.
| Rolling Period | Fund Avg (%) | Benchmark Avg (%) | Fund Median (%) | Benchmark Median (%) | Fund Max (%) | Benchmark Max (%) | Fund Min (%) | Benchmark Min (%) |
| 1 Year | 23.31% | 20.95% | 16.99% | 10.52% | 100.71% | 135.79% | -14.79% | -41.65% |
| 2 Years | 21.44% | 17.99% | 19.61% | 18.37% | 65.53% | 78.91% | -7.88% | -30.10% |
| 3 Years | 21.45% | 17.27% | 19.97% | 19.78% | 41.27% | 44.66% | -0.03% | -17.52% |
| 5 Years | 21.61% | 15.66% | 21.69% | 14.61% | 35.09% | 40.05% | 4.98% | -5.83% |
| 10 Years | 21.13% | 16.76% | 20.32% | 16.21% | 26.33% | 21.80% | 17.75% | 12.83% |
B. Rolling Returns (From January 2020 to As-on Date)
This analysis focuses on the recent market cycle, covering the 2020 market correction, the subsequent liquidity recovery, the extended bull market, and recent corrections.
| Rolling Period | Fund Avg (%) | Benchmark Avg (%) | Fund Median (%) | Benchmark Median (%) | Fund Max (%) | Benchmark Max (%) | Fund Min (%) | Benchmark Min (%) |
| 1 Year | 28.89% | 32.29% | 23.27% | 26.99% | 97.93% | 135.79% | -5.32% | -11.87% |
| 2 Years | 25.99% | 27.35% | 27.21% | 27.35% | 65.33% | 78.91% | 4.23% | -1.16% |
| 3 Years | 25.49% | 27.11% | 24.23% | 25.70% | 41.20% | 44.60% | 14.28% | 13.74% |
| 5 Years | 25.91% | 26.79% | 26.55% | 27.31% | 35.09% | 40.05% | 17.10% | 15.49% |
Crucial Insights from Axis Small Cap Fund Rolling Returns
- Downside Protection Edge: The fund’s absolute historical minimum returns highlight its focus on capital preservation. Over a 3-year rolling window since inception, the fund’s worst performance was a near-flat -0.03%, compared to a sharp -17.52% drop for the benchmark index.
- Long-Term Consistency: Looking at the 5-year and 10-year rolling metrics since inception, the fund’s average and median returns consistently outperform the benchmark. Its 10-year rolling minimum stands at a reliable 17.75%.
- Recent Cycle Trade-offs: The post-2020 data shows the trade-offs of this defensive approach. During this aggressive growth phase, the fund’s 3-year rolling average (25.49%) and median (24.23%) lagged slightly behind the benchmark’s averages (27.11% and 25.70%). This confirms that the portfolio’s quality filter can underperform during rapid, low-quality market rallies.
5. Benchmark Outperformance Ratio (BOR) for Axis Small Cap Fund Direct Plant Growth
To refine our analysis beyond standard rolling metrics, we use the Benchmark Outperformance Ratio (BOR). This analytical tool measures the exact percentage of business days over a specific horizon where the fund’s rolling returns exceeded the benchmark index.
$$\text{BOR (\%)} = \left( \frac{\text{Number of Rolling Return Observations Where Fund Outperformed Benchmark}}{\text{Total Rolling Return Observations}} \right) \times 100$$
A. BOR Analysis (From Fund Inception to As-on Date)
This lifetime analysis tracks how consistently the fund has added value over its benchmark across different market environments.
| Rolling Horizon | Fund Win Percentage (%) | Benchmark Win Percentage (%) | BOR Rating |
| 1-Year Rolling | 60.00% | 40.00% | Good |
| 2-Year Rolling | 63.64% | 36.36% | Good |
| 3-Year Rolling | 80.00% | 20.00% | Excellent |
| 5-Year Rolling | 73.33% | 26.67% | Very Good |
| 7-Year Rolling | 100.00% | 0.00% | Outstanding |
| 10-Year Rolling | 100.00% | 0.00% | Outstanding |
B. BOR Analysis (January 2020 to As-on Date)
This targeted analysis looks at the fund’s success rate over the post-2020 market cycle.
| Rolling Horizon | Fund Win Percentage (%) | Benchmark Win Percentage (%) | BOR Rating |
| 1-Year Rolling | 55.56% | 44.44% | Weak |
| 2-Year Rolling | 55.56% | 44.44% | Weak |
| 3-Year Rolling | 30.00% | 70.00% | Weak |
| 5-Year Rolling | 33.33% | 66.67% | Weak |
Evaluating the Axis Small Cap Fund BOR
Comparing these two tables reveals a clear distinction in performance regimes. Looking at its full history, the fund displays exceptional long-term consistency, achieving a 100% BOR over all 7-year and 10-year rolling horizons.
However, looking at the post-2020 window reveals a different trend. The 3-year BOR drops to 30.00%, and the 5-year BOR sits at 33.33%. This shows that during the recent broad market expansion, a quality-focused, large-scale small-cap portfolio has faced challenges keeping pace with the benchmark on a daily rolling basis.
6.Axis Small Cap Fund Risk Analysis
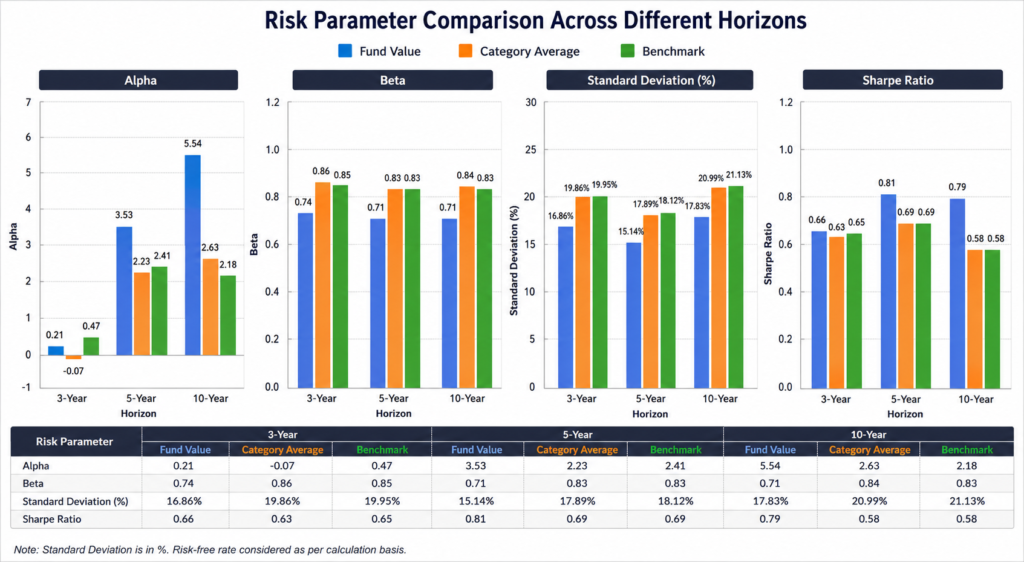
A comprehensive Axis Small Cap Fund Risk Analysis helps explain how these returns are generated, evaluating whether the performance is driven by high risk or genuine structural manager skill.
A. Core Volatility & Risk-Adjusted Return Ratios
| Risk Parameter | Horizon | Fund Value | Category Average | Benchmark |
| Alpha | 3-Year 5-Year 10-Year | 0.21 3.53 5.54 | -0.07 2.23 2.63 | 0.47 2.41 2.18 |
| Beta | 3-Year 5-Year 10-Year | 0.74 0.71 0.71 | 0.86 0.83 0.84 | 0.85 0.83 0.83 |
| Standard Deviation (%) | 3-Year 5-Year 10-Year | 16.86% 15.14% 17.83% | 19.86% 17.89% 20.99% | 19.95% 18.12% 21.13% |
| Sharpe Ratio | 3-Year 5-Year 10-Year | 0.66 0.81 0.79 | 0.63 0.69 0.58 | 0.65 0.69 0.58 |
B. Portfolio Correlation, Efficiency, & Market Capture
| Risk Parameter | Horizon | Fund Value | Category Average | Benchmark / Variance |
| Tracking Error (%) | 3-Year 5-Year 10-Year | 6.53% 6.74% 7.33% | — — — | 6.50% 6.40% 7.33% |
| R-Squared ($R^2$ %) | 3-Year 5-Year 10-Year | 94.72% 92.77% 89.87% | 92.22% 89.61% 90.88% | 91.80% 89.70% 90.69% |
| Upside Capture Ratio | 3-Year 5-Year 10-Year | 77 77 80 | 85 85 87 | 88 88 90 |
| Downside Capture Ratio | 3-Year 5-Year 10-Year | 70 57 55 | 81 72 75 | 75 70 70 |
Technical Breakdown of the Alpha Beta Sharpe Ratio Metrics
- Volatility Insulation: The fund maintains a low Standard Deviation (15.14% over 5 years) and a Beta of 0.71 to 0.74 relative to the market. This indicates that the portfolio is structurally designed to be less volatile than the broader small-cap segment.
- The Downside Capture Edge: The key driver of the fund’s long-term performance is its downside protection. Its 10-Year Downside Capture Ratio stands at 55, meaning it historically absorbed only 55% of market corrections. This defensive cushion helps preserve capital, leading to a strong long-term 10-Year Alpha of 5.54.
- Upside Limitation Realities: This focus on downside protection means the fund captures less of the market’s gains during rapid expansions. With an Upside Capture Ratio consistently at 77 to 80, it trails the benchmark’s upside capture of 88 to 90.
- Statistical Explanations ($R^2$ & Tracking Error): A 3-year R-Squared value of 94.72% shows a high correlation with the index’s broader direction, while its tracking error (~6.53% to 7.33%) reflects the active security choices made within its quality framework.
7. Expense Ratio
The expense ratio represents the annual management fee charged by the asset management company, which directly influences net long-term compounding.
| Parameter | Value |
| Expense Ratio (Direct Growth) | 1.67% |
| Category Designation | Small Cap Equity Fund |
| Underlying Benchmark | Nifty Smallcap 250 TRI |
For direct growth plans, a cost structure of 1.67% requires steady alpha generation to fully justify the active management fees. Investors should monitor how this cost structure compares to category peers to ensure net performance remains competitive.
8. Assets Under Management (AUM)
In small-cap investing, the total asset pool size significantly affects operational flexibility and liquidity management.
| Parameter | Value |
| Assets Under Management (AUM) | ₹27,840.05 Crore |
| Fund Position Accounting | Equity – Small Cap Category |
| Total Tracked Fund Age | Approximately 12.5 Years |
All recorded structural asset allocations reflect audited positions as of May 2026.
Managing an AUM of ₹27,840.05 Crore in the small-cap segment is a unique operational challenge. Because smaller companies have lower daily trading volumes, a larger fund size makes it more difficult to quickly build or exit meaningful equity positions without causing price slippage. To manage this liquidity risk, the fund often carries higher cash buffers or selectively adds liquid mid-cap allocations.
9. Fund Manager Analysis
The fund is managed by the institutional investment desk at Axis Mutual Fund. The team uses a quality-first, bottom-up research model designed to ensure continuity across different market cycles.
| Parameter | Details |
| Core Desk Focus | Quality-Oriented Small-Cap Value & Growth Creation |
| Primary Benchmark Hurdle | Nifty Smallcap 250 TRI |
| Core Sector Concentration | Financials, Capital Goods, Chemicals, Technology, Healthcare |
The management team emphasizes balance sheet health, looking closely at parameters like low leverage, strong return on equity (ROE), and steady operating cash flows. This focus helps avoid highly speculative stocks, giving the portfolio a distinct defensive orientation.
10. Strengths
- Defensive Design: A consistent Beta below 0.75 provides a reliable safety cushion during market drawdowns.
- Downside Protection: With a long-term downside capture ratio of 55, the fund excels at preserving capital during market corrections.
- Long-Term Track Record: A 10-year CAGR of 20.17% confirms its ability to build wealth over full economic cycles.
- Strong Risk-Adjusted Metrics: A 10-year Sharpe Ratio of 0.79 beats both its category average and the benchmark index.
11. Weaknesses
- Underperformance in Bull Markets: An upside capture ratio of 77–80 means the fund can lag behind during fast-moving, momentum-driven market rallies.
- Larger Asset Size (AUM): An AUM approaching ₹28,000 Crore may limit the fund’s ability to invest in agile, micro-cap opportunities.
- Recent Performance Slowdown: Post-2020 rolling return metrics and BOR values indicate a cooling of alpha generation compared to more aggressive peers.
12. Who Should Invest?
This fund is well-suited for risk-aware equity investors seeking exposure to smaller companies but prioritizing downside protection. It is a good fit for long-term Systematic Investment Plans (SIPs) with an investment horizon of 5 to 7+ years, where the goal is consistent compounding rather than chasing short-term market momentum.
13. Who Should Avoid?
Investors seeking short-term momentum or looking to maximize returns during an aggressive bull market may find the fund’s defensive style limiting. It is less suitable for tactical, short-term portfolios that require high upside capture over brief horizons.
14. Final Verdict
The performance dynamics of the Axis Small Cap Fund have fundamentally shifted, and a clear distinction must be made between its historical legacy and its current trajectory. Looking closely at its performance from 2020 onwards, the fund’s quality-focused, large-scale approach has led to a noticeable slowdown in alpha generation during recent market expansions. This makes it increasingly difficult to justify the scheme for fresh capital deployment.
For existing investors who already have long-running SIPs, the fund’s strong structural downside protection means it can still be looked at as a Hold to anchor a portfolio against severe market drawdowns. However, for new investors entering the small-cap space in 2026, the fund is not suitable as a primary growth engine.
The small-cap category currently offers more agile alternatives with lower asset bases and better upside capture ratios. These competing funds have proven far more effective at navigating the modern market cycle and generating benchmark-beating returns. New capital is better directed toward these top-performing small-cap peers that offer superior wealth-creation velocity without sacrificing core risk-adjusted parameters.
15. FAQs
Q1: What is the latest AUM of the Axis Small Cap Fund?
As of May 2026, the fund manages an architecture of ₹27,840.05 Crore, making it one of the largest specialized small-cap offerings in India.
Q2: Which index does the fund use as its primary benchmark?
The underlying asset map evaluates performance against the Nifty Smallcap 250 TRI and the BSE 250 SmallCap TRI.
Q3: What does the 10-year Downside Capture Ratio of 55 mean?
It indicates that over the last decade, the fund absorbed only 55% of the losses experienced by its benchmark index during market declines, showcasing strong capital preservation.
Q4: Why has the fund’s recent post-2020 BOR declined?
The Benchmark Outperformance Ratio declined because the fund’s quality filters naturally avoid highly speculative, momentum-driven stocks that led parts of the post-2020 market rally.
Q5: What is the current Expense Ratio for the Direct Growth plan?
The fund charges an active direct management expense fee of 1.67%.
Q6: Is this fund suitable for short-term lump sum investments?
No. Small-cap equities require a long-term investment horizon. A minimum investment window of 5 to 7 years is recommended to navigate standard market volatility.
Q7: How does a low Beta benefit retail investors?
A Beta of 0.71 means the fund is historically 29% less volatile than the benchmark index, resulting in smaller price swings during market corrections.
Q8: What is the main risk associated with the fund’s larger AUM size?
A larger AUM can limit flexibility, making it more difficult to efficiently enter or exit smaller, less liquid equity positions without impacting market prices.
Q9: Does the fund invest entirely in small-cap companies?
The fund maintains at least 65% of its portfolio in small-cap stocks, while the remaining allocation can be strategically deployed into mid-caps or held in cash for liquidity management.
Q10: What is the current exit load structure?
Redemptions within 12 months from the allotment date generally incur a standard 1% exit load on allocations exceeding the fund’s permitted exit threshold.
16. Conclusion
Our detailed review of the Axis Small Cap Fund Review 2026 highlights a clear trade-off between risk and reward. The fund continues to offer excellent downside protection and strong risk-adjusted returns over long horizons, supported by its long-term Alpha of 5.54 and a 10-year CAGR of 20.17%. While its defensive style means it may lag behind during aggressive, speculative bull markets, its structural consistency remains highly beneficial for long-term portfolios. For investors focused on long-term capital compounding over multiple market cycles, this quality-centric fund remains a dependable choice in the Best Small Cap Mutual Fund category.