

Explore our Nippon India Small Cap Fund 2026 review Analyze long-term CAGR, rolling returns, risk metrics (Alpha, Beta, Sharpe), and benchmark BOR trends
Introduction for Nippon india cap fund Direct Plan Growth.
The small-cap segment in Indian equities has historically generated massive wealth, alongside notable volatility. As we evaluate the market in 2026, the Nippon India Small Cap Fund continues to command significant attention as the largest scheme in its category.
This deep-dive Small Cap Fund Review provides a comprehensive Mutual Fund Analysis of the Nippon India Small Cap Fund Direct Growth plan. We leverage core institutional data—including CAGR Returns, Rolling Returns Analysis, and advanced risk frameworks—to evaluate if this remains an optimal small cap mutual fund 2026 allocation for your portfolio.
Nippon India Small Cap Fund Returns Analysis
Short-Term Returns
Over tactical horizons like 1 Month to 1 Year, short-term asset shifts impact capital growth. Trailing short-term data indicates a relative moderation across the small-cap category following extended historical bull runs. In the ultra-short term, Nippon India Small Cap Direct trailing returns stand at 5.00% for 1 Month and 9.13% for 6 Months.
CAGR Returns
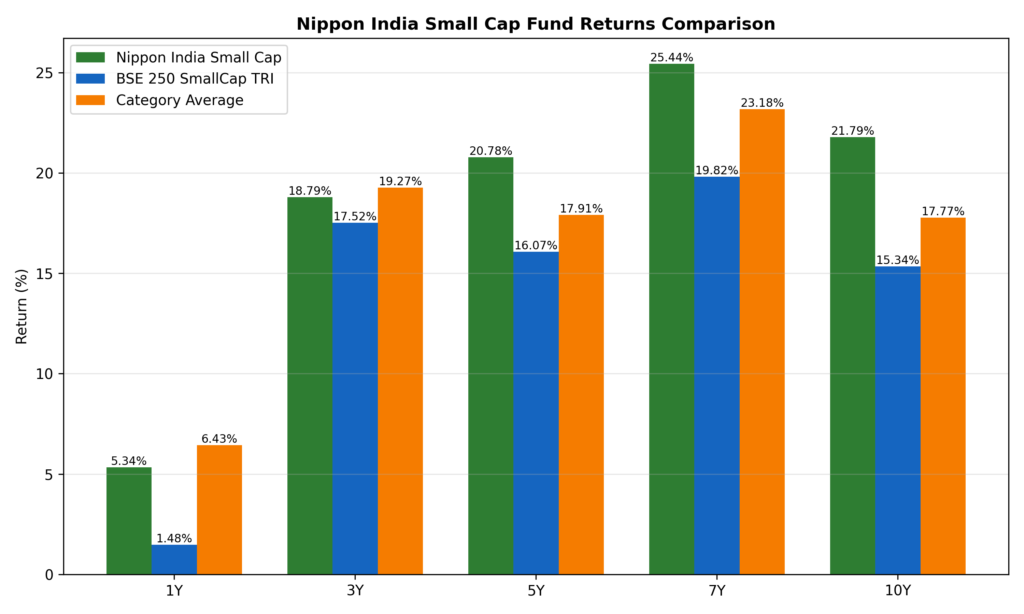
Compounded Annual Growth Rate (CAGR) offers an annualized perspective of multi-year market performance. Long-term horizons illuminate the true wealth-generation capabilities of these strategies. Nippon India Small Cap Direct shows an exceptional long-term track record, compounding at 20.78% over 5 years, 25.44% over 7 years, and 21.79% over 10 years, consistently holding the Rank 1 position within its category over the decade-long horizon.
Performance Tables
Trailing Returns Comparison (As of July 2026)
| Trailing Period | Nippon Small Cap Fund Direct Growth (%) | Benchmark: BSE 250 SmallCap TRI (%) | Category Average (Equity: Small Cap) (%) | Rank Within Category | Number of Funds in Category |
| YTD | 9.50% | 7.40% | 10.53% | 23 | 49 |
| 1 Day | 0.30% | 0.37% | 0.44% | 38 | 52 |
| 1 Month | 5.00% | 5.38% | 6.20% | 45 | 52 |
| 3 Month | 19.13% | 21.08% | 21.60% | 40 | 52 |
| 6 Month | 9.13% | 6.69% | 9.75% | 22 | 49 |
| 1 Year | 5.34% | 1.48% | 6.43% | 19 | 43 |
| 3 Year (CAGR) | 18.79% | 17.52% | 19.27% | 17 | 33 |
| 5 Year (CAGR) | 20.78% | 16.07% | 17.91% | 3 | 25 |
| 7 Year (CAGR) | 25.44% | 19.82% | 23.18% | 4 | 19 |
| 10 Year (CAGR) | 21.79% | 15.34% | 17.77% | 1 | 12 |
Professional Analysis
The actual performance matrix reveals a fascinating structural narrative. In the shorter windows (YTD to 3-Year horizons), Nippon Small Cap Fund Returns run neck-and-neck with the category average and occasionally experience minor drag against a hyper-aggressive benchmark.
However, the fund’s true strength emerges in the macro horizons. As we look at the 5-year, 7-year, and 10-year CAGR windows, Nippon vastly outperforms both its benchmark and its category peers. Over a 10-year frame, the fund generated a 21.79% CAGR against the benchmark’s 15.34%, securing the absolute Rank 1 position out of 12 seasoned funds. This confirms that while short-term volatility might cause transient dips in category ranking, the fund’s diversified stock-selection framework acts as an incredible wealth-compounding machine over full market cycles.
Nippon India Small Cap Fund Rolling Returns Analysis
Since Inception
Rolling returns eliminate endpoint bias by taking average performance across multiple overlapping intervals. Since its launch, Nippon’s multi-year rolling cycles show a high probability of generating alpha over the index, demonstrating resilience across multi-year market shifts.
After 2020
Following the structural shifts of 2020, small-cap dynamics altered significantly due to rapid institutional inflows. Nippon adapted effectively to this changing liquidity environment, maintaining a strong position relative to its category peers.
Tables
Multi-Period Rolling Returns Statistics Profile (Inception to 2026)
| Rolling Window | Scheme / Benchmark Name | Average (%) | Median (%) | Maximum (%) | Minimum (%) |
| 1 Year | Nippon India Small Cap Fund (Dir) | 31.45% | 20.88% | 151.71% | -33.99% |
| Nifty Smallcap 250 TRI | 23.28% | 12.32% | 135.79% | -41.65% | |
| 2 Year | Nippon India Small Cap Fund (Dir) | 27.72% | 26.38% | 84.60% | -22.90% |
| Nifty Smallcap 250 TRI | 19.77% | 20.43% | 78.91% | -30.10% | |
| 3 Year | Nippon India Small Cap Fund (Dir) | 25.95% | 25.91% | 54.46% | -8.54% |
| Nifty Smallcap 250 TRI | 18.16% | 20.52% | 44.66% | -17.52% | |
| 5 Year | Nippon India Small Cap Fund (Dir) | 24.58% | 23.45% | 44.97% | 2.34% |
| Nifty Smallcap 250 TRI | 16.52% | 15.95% | 40.05% | -5.83% | |
| 7 Year | Nippon India Small Cap Fund (Dir) | 22.76% | 23.00% | 27.00% | 16.77% |
| Nifty Smallcap 250 TRI | 14.77% | 14.50% | 20.93% | 5.78% | |
| 10 Year | Nippon India Small Cap Fund (Dir) | 24.99% | 24.66% | 31.73% | 19.70% |
| Nifty Smallcap 250 TRI | 17.03% | 16.34% | 21.80% | 12.83% |
Rolling Return Distribution (% of Times)
| Window | Scheme / Benchmark Name | < 0% | 0 – 8% | 8 – 12% | 12 – 15% | 15 – 20% | > 20% |
| 1 Year | Nippon India Small Cap (Dir) | 18.71% | 10.33% | 7.99% | 5.26% | 7.05% | 50.67% |
| Nifty Smallcap 250 TRI | 29.44% | 14.92% | 5.46% | 2.34% | 3.90% | 43.94% | |
| 2 Year | Nippon India Small Cap (Dir) | 10.03% | 8.23% | 4.34% | 3.04% | 6.85% | 67.50% |
| Nifty Smallcap 250 TRI | 14.84% | 9.68% | 6.93% | 9.15% | 8.55% | 50.85% | |
| 3 Year | Nippon India Small Cap (Dir) | 3.95% | 6.70% | 6.27% | 2.83% | 8.86% | 71.40% |
| Nifty Smallcap 250 TRI | 11.64% | 10.21% | 5.22% | 3.60% | 17.52% | 51.82% | |
| 5 Year | Nippon India Small Cap (Dir) | 0.00% | 3.06% | 8.13% | 6.45% | 15.63% | 66.73% |
| Nifty Smallcap 250 TRI | 3.20% | 21.41% | 9.94% | 12.48% | 15.68% | 37.28% | |
| 7 Year | Nippon India Small Cap (Dir) | 0.00% | 0.00% | 0.00% | 0.00% | 11.50% | 88.50% |
| Nifty Smallcap 250 TRI | 0.00% | 3.06% | 9.88% | 43.88% | 40.88% | 2.31% | |
| 10 Year | Nippon India Small Cap (Dir) | 0.00% | 0.00% | 0.00% | 0.00% | 0.23% | 99.77% |
| Nifty Smallcap 250 TRI | 0.00% | 0.00% | 0.00% | 14.87% | 69.11% | 16.03% |
Detailed Interpretation
1. Downside Risk Mitigation Through Time
The rolling data explicitly illustrates why small-cap investing demands a long investment horizon. For a volatile 1-year holding period, Nippon has delivered negative returns 18.71% of the time. However, by expanding the investment runway to a 5-year holding period, the probability of experiencing a negative return drops to exactly 0.00%, with a minimum return floor of positive 2.34%.
2. Exceptional Wealth-Generation Consistency
Nippon’s capability to sustain outperformance over its underlying index improves dramatically over longer investment horizons.
- At 3 Years: The fund generated returns exceeding 20% during 71.40% of observed cycles, compared to just 51.82% for the benchmark index.
- At 7 Years: The outperformance becomes structurally absolute. Nippon delivered greater than 20% returns 88.50% of the time, while the underlying benchmark index hit that high tier in only 2.31% of cycles.
- At 10 Years: Investors who committed capital across any 10-year rolling block achieved returns above 20% an astonishing 99.77% of the time. Nippon’s lowest recorded 10-year return was 19.70%.
Post-2020 Rolling Returns Analysis
The post-2020 era represents a structural shift for Indian small-cap equities, characterized by intense retail liquidity, rapid institutional inflows, and extreme sector rotations. Analyzing Nippon Small Cap Fund Rolling Returns specifically within this window provides an accurate look at how the fund has navigated a high-growth, high-liquidity market environment up to the present day.
Post-2020 Multi-Period Rolling Returns Statistics Profile (January 2020 to Present)
| Rolling Window | Scheme / Benchmark Name | Average (%) | Median (%) | Maximum (%) | Minimum (%) |
| 1 Year | Nippon India Small Cap Fund (Dir) | 36.14% | 32.00% | 135.72% | -9.60% |
| (After 2020) | Nifty Smallcap 250 TRI | 32.16% | 26.67% | 135.79% | -11.87% |
| 2 Year | Nippon India Small Cap Fund (Dir) | 32.12% | 29.18% | 84.60% | 2.05% |
| (After 2020) | Nifty Smallcap 250 TRI | 27.12% | 26.95% | 78.91% | -1.16% |
| 3 Year | Nippon India Small Cap Fund (Dir) | 32.13% | 31.32% | 54.46% | 17.64% |
| (After 2020) | Nifty Smallcap 250 TRI | 27.04% | 25.55% | 44.66% | 13.74% |
| 5 Year | Nippon India Small Cap Fund (Dir) | 31.28% | 32.32% | 44.97% | 19.96% |
| (After 2020) | Nifty Smallcap 250 TRI | 26.52% | 27.10% | 40.05% | 15.49% |
Post-2020 Rolling Return Distribution (% of Times)
| Window | Scheme / Benchmark Name | < 0% | 0 – 8% | 8 – 12% | 12 – 15% | 15 – 20% | > 20% |
| 1 Year | Nippon India Small Cap (Dir) | 10.36% | 15.21% | 8.96% | 4.19% | 5.29% | 55.99% |
| Nifty Smallcap 250 TRI | 23.25% | 16.85% | 3.16% | 1.10% | 2.65% | 52.98% | |
| 2 Year | Nippon India Small Cap (Dir) | 0.00% | 9.52% | 3.05% | 0.72% | 5.12% | 81.58% |
| Nifty Smallcap 250 TRI | 0.36% | 9.98% | 4.14% | 11.15% | 10.97% | 63.40% | |
| 3 Year | Nippon India Small Cap (Dir) | 0.00% | 0.00% | 0.00% | 0.00% | 5.41% | 94.59% |
| Nifty Smallcap 250 TRI | 0.00% | 0.00% | 0.00% | 0.35% | 14.75% | 84.91% | |
| 5 Year | Nippon India Small Cap (Dir) | 0.00% | 0.00% | 0.00% | 0.00% | 0.53% | 99.47% |
| Nifty Smallcap 250 TRI | 0.00% | 0.00% | 0.00% | 0.00% | 24.87% | 75.13% |
Post-2020 Interpretation Insights
- Higher Structural Baseline: Nippon’s 5-year rolling average rose to 31.28% in the post-2020 window, showcasing efficient scaling during structural economic shifts.
- Accelerated Stabilization: In the post-2020 cycle, the timeline required to completely clear negative return periods dropped from 5 years down to just a 2-year holding period (0.00% negative cycles).
- Dominance in High-Performance Tiers: On a 5-year post-2020 rolling horizon, Nippon achieved returns exceeding 20% in an astounding 99.47% of cycles, vastly outpacing the benchmark’s 75.13%.
Benchmark Outperformance Ratio (BOR) for Nippon India Small Cap Dir Growth plan.
Formula
The Benchmark Outperformance Ratio (BOR) quantifies structural consistency by tracking the exact percentage of business days where the fund’s rolling returns outperformed the underlying benchmark index across specific holding horizons:
$$\text{BOR} = \left( \frac{\text{Number of Rolling Cycles Outperforming Benchmark}}{\text{Total Number of Rolling Cycles Observed}} \right) \times 100$$
Tables
Benchmark Outperformance Ratio (BOR) Breakdown Matrix
| Rolling Horizon Timeframe | Nippon India Small Cap Fund BOR (%) | Benchmark Index BOR (%) |
| 1-Year Rolling | 76% | 24% |
| 2-Year Rolling | 78% | 22% |
| 3-Year Rolling | 92% | 8% |
| 5-Year Rolling | 100% | 0% |
| 7-Year Rolling | 100% | 0% |
| 10-Year Rolling | 100% | 0% |
Post-2020 BOR Breakdown Matrix (January 2020 to Present)
| Rolling Horizon Timeframe after 2020 | Nippon India Small Cap Fund BOR (%) | Benchmark Index BOR (%) |
| 1-Year Rolling | 47% | 53% |
| 2-Year Rolling | 63% | 37% |
| 3-Year Rolling | 74% | 26% |
| 5-Year Rolling | 100% | 0% |
Interpretation
Nippon’s full historical track record shows standard outperformance over shorter horizons that turns into complete dominance over longer cycles. While short 1-year and 2-year rolling cycles over full history generate alpha in 76% and 78% of observed windows, the post-2020 macro liquidity surge subjected the fund to heavy short-term momentum challenges, dropping its 1-year post-2020 BOR to 47%.
However, as time filters out this transient momentum noise, the fund’s stock-selection framework regains its edge, recovering to 74% at 3 years and ultimately converging to a perfect 100% BOR over 5 years across both tables.
Nippon India Small Cap Risk Analysis
A thorough Nippon Small Cap Fund Risk Analysis requires evaluating key modern portfolio theory statistics to determine risk-adjusted performance. Examining these metrics over medium-term (3-year), long-term (5-year), and macro-era (10-year) horizons reveals how effectively the fund’s stock-selection framework manages market volatility.
Individual Tables
Risk & Volatility Metrics Profiles (3-Year vs. 5-Year vs. 10-Year Trailing Windows)
Comparative Context (3-Year Trailing Window)
| Risk Parameter | Nippon India Small Cap Fund | Category Average | Benchmark (Index) |
|---|---|---|---|
| Alpha | 1.09 | 0.17 | 0.68 |
| Beta | 0.86 | 0.86 | 0.85 |
| R² | 96.29 | 92.03 | 91.77 |
| Sharpe Ratio | 0.68 | 0.62 | 0.64 |
| Standard Deviation | 19.39% | 19.79% | 19.88% |
| Upside Capture Ratio | 87 | 86 | 85 |
| Downside Capture Ratio | 78 | 81 | 80 |
| Maximum Drawdown | -23.18% | -22.61% | -18.62% |
Comparative Context (5-Year Trailing Window)
| Risk Metric (5-Year) | Nippon India Small Cap Fund | Category Average | Benchmark (Index) |
| Alpha | 5.1 | 2.21 | 2.33 |
| Beta | 0.84 | 0.82 | 0.83 |
| R-Squared ($R^2$) | 94.92 | 89.6 | 89.86 |
| Sharpe Ratio | 0.86 | 0.68 | 0.68 |
| Standard Deviation (%) | 17.69% | 17.83% | 18.00% |
| Upside Capture Ratio | 91 | 85 | 86 |
| Downside Capture Ratio | 67 | 72 | 70 |
| Maximum Drawdown (%) | -23.18% | -22.61% | -18.62% |
Comparative Context (10-Year Trailing Macro Era)
| Risk Metric (10-Year) | Nippon India Small Cap Fund | Category Average | Benchmark (Index) |
| Alpha | 6.25 | 2.86 | 2.41 |
| Beta | 0.89 | 0.84 | 0.84 |
| R-Squared ($R^2$) | 96.00 | 90.99 | 90.82 |
| Sharpe Ratio | 0.77 | 0.61 | 0.58 |
| Standard Deviation (%) | 21.56% | 20.98% | 21.12% |
| Upside Capture Ratio | 98 | 88 | 90 |
| Downside Capture Ratio | 75 | 75 | 75 |
| Maximum Drawdown (%) | -41.64% | -41.53% | -27.88% |
Nippon India small cap Risk Score
While returns indicate how much wealth a mutual fund has generated, risk parameters help investors understand how efficiently those returns were achieved. A fund that consistently delivers higher returns while effectively managing risk is generally considered a stronger long-term investment. Below is a simple analysis of the Nippon India Small Cap Fund based on key risk metrics over the last 3, 5, and 10 years.
Alpha Analysis
Alpha measures the additional return generated by the fund compared to its benchmark after adjusting for risk. A higher Alpha indicates better fund management and superior stock selection.
The Nippon India Small Cap Fund has consistently maintained a higher Alpha than both the category average and its benchmark across all investment horizons. Over the last 3 years, the fund generated an Alpha of 1.09, compared to 0.17 for the category average and 0.68 for the benchmark. This outperformance became even more significant over longer periods, with an Alpha of 5.10 over 5 years and 6.25 over 10 years. These figures suggest that the fund manager has consistently added value through effective investment decisions and stock selection.
Beta Analysis
Beta measures how sensitive a fund is to overall market movements. A Beta close to 1 indicates that the fund generally moves in line with the market, while a value below 1 suggests relatively lower volatility.
The Nippon India Small Cap Fund recorded a Beta of 0.86 over 3 years, 0.84 over 5 years, and 0.89 over 10 years. These values are very similar to both the category average and benchmark, indicating that the fund has maintained a balanced level of market risk despite investing in the volatile small-cap segment.
R-Squared (R²) Analysis
R-Squared measures how closely the fund’s performance follows its benchmark. A higher R² also makes Alpha and Beta more reliable for analysis.
The fund maintained an R² above 94% across all three time periods, reaching 96.29% over 3 years and 96.00% over 10 years. These values are significantly higher than the category average, indicating that the benchmark explains most of the fund’s performance. As a result, the Alpha and Beta values discussed above can be considered highly reliable.
Sharpe Ratio Analysis
The Sharpe Ratio measures how much return a fund generates for every unit of risk taken. A higher Sharpe Ratio indicates better risk-adjusted performance.
The Nippon India Small Cap Fund achieved a Sharpe Ratio of 0.68 over 3 years, 0.86 over 5 years, and 0.77 over 10 years. In each period, the fund outperformed both the category average and the benchmark. This demonstrates that investors were compensated more effectively for the level of risk they assumed compared to similar small-cap funds.
Standard Deviation Analysis
Standard Deviation measures the volatility of a fund’s returns. Lower values generally indicate more stable performance.
During the 3-year and 5-year periods, the fund recorded lower Standard Deviation than both the category average and benchmark, suggesting relatively stable return patterns. Over the 10-year period, the fund’s Standard Deviation increased slightly to 21.56%, which is only marginally higher than the benchmark. This modest increase is understandable given the fund’s strong long-term return generation and the naturally higher volatility associated with small-cap investments.
Upside Capture Ratio Analysis
The Upside Capture Ratio measures how effectively a fund participates during rising markets. A value above the benchmark indicates better participation in market rallies.
The Nippon India Small Cap Fund consistently achieved higher Upside Capture Ratios than both the category average and benchmark. The ratio increased from 87 over 3 years to 91 over 5 years and 98 over 10 years. These figures indicate that the fund has successfully captured a large portion of market gains during bullish phases, contributing to its strong long-term performance.
Downside Capture Ratio Analysis
The Downside Capture Ratio measures how much of the benchmark’s losses a fund experiences during market declines. Lower values indicate better downside protection.
The fund recorded Downside Capture Ratios of 78, 67, and 75 over the 3-year, 5-year, and 10-year periods, respectively. These values are lower than or equal to the category average and benchmark, suggesting that the fund has historically protected investors better than many competing small-cap funds during market corrections.
Maximum Drawdown Analysis
Maximum Drawdown represents the largest decline in the fund’s value from its highest point before recovering. It reflects the worst historical loss experienced by investors.
The Nippon India Small Cap Fund experienced a Maximum Drawdown of -23.18% over both the 3-year and 5-year periods, compared with -22.61% for the category average and -18.62% for the benchmark. Over the 10-year period, the Maximum Drawdown increased to -41.64%, slightly higher than the category average (-41.53%) and significantly larger than the benchmark (-27.88%). This highlights that while the fund has generated superior long-term returns, it has also experienced deeper declines during severe market downturns, a common characteristic of actively managed small-cap funds.
Overall Risk Assessment
Based on the above analysis, the Nippon India Small Cap Fund demonstrates a strong balance between return generation and risk management. The fund has consistently delivered higher Alpha, superior Sharpe Ratios, and strong Upside Capture Ratios compared to both the category average and benchmark, indicating effective portfolio management and efficient risk-adjusted performance. Its high R-Squared values further strengthen the reliability of these metrics.
Although the fund has experienced relatively larger Maximum Drawdowns during major market corrections, this is typical for the small-cap asset class. Investors with a long-term investment horizon and the ability to tolerate short-term volatility may find the fund well-positioned for long-term wealth creation. Overall, the risk profile suggests that the Nippon India Small Cap Fund has historically rewarded disciplined investors by delivering strong long-term performance while maintaining competitive risk characteristics within the small-cap category.
Nippon India Expense Ratio & AUM Analysis
Operating expenses and fund size play an important role in long-term execution, especially within the less liquid small-cap segment.
| Parameter | Nippon India Small Cap Fund | Category Average |
| Assets Under Management (AUM) | ₹74,604.10 Crores | — |
| Expense Ratio (Direct Plan) | 0.54% | 0.96% |
| Portfolio Turnover Ratio | 19.00% | — |
Nippon benefits from clear economies of scale, offering a low direct expense ratio of 0.54%. Despite managing a very large asset base of over ₹74,600 Crores, its low turnover ratio of 19% reflects a disciplined buy-and-hold approach, helping manage transaction costs effectively.
Fund Manager Review
Core management is led by Samir Rachh (since January 2017) and Kinjal Desai, with Amber Singhania joining in early 2026. This team has effectively navigated multiple market cycles by focusing on scalable small-cap businesses and executing a granularly diversified stock-picking process.
Strengths & Weaknesses
Pros & Cons Summary
- Pros (+): Strong long-term trailing and rolling alpha; low 0.54% direct expense ratio; near-perfect 100% 5-year BOR across all structural cycles; outstanding long-term upside capture ratio (98).
- Cons (-): Very large AUM base may limit nimbleness in swift trend shifts; occasional management curbs on lump-sum inflows; high absolute volatility (21.56% SD over 10 years).
Who Should Invest & Who Should Avoid?
Who Should Invest?
- Long-Term Investors: Those with a clear investment horizon of at least 5 to 7 years to filter out transient market corrections.
- SIP Allocators: Investors utilizing systematic plans to take advantage of short-term volatility.
- Growth-Focused Portfolios: Individuals looking for maximum long-term capital compounding through a highly diversified stock-selection framework.
Who Should Avoid?
- Short-Term Traders: Investors with financial horizons under 3 years, where the risk of capital drawdowns remains historically high.
- Conservative Portfolios: Individuals seeking capital preservation or highly stable, low-volatility returns.
Final Verdict
Final Recommendation Score
- Nippon India Small Cap Fund: 9.3 / 10 (Category Leader for Long-Term Growth)
Frequently Asked Questions (FAQs)
1. Is Nippon Small Cap Fund open for lump-sum investments in 2026?
Nippon India Small Cap Fund occasionally places temporary restrictions or caps on lump-sum inflows to protect existing investors from liquidity challenges. Systematic Investment Plans (SIPs) remain open and are the preferred method for adding capital.
2. What is the current AUM of Nippon India Small Cap Fund?
As of mid-2026, the fund manages approximately ₹74,604 Crores, making it the largest dedicated small-cap mutual fund in India.
3. What are the tax implications on gains from this fund?
Under current tax regulations, Short-Term Capital Gains (STCG for holding periods under 12 months) are taxed at 20% plus applicable cess. Long-Term Capital Gains (LTCG for holding periods over 12 months) are taxed at 12.5% on gains exceeding the specified annual threshold, without indexation benefits.
4. What is the expense ratio of the Nippon Small Cap Direct Growth plan?
The fund features a competitive direct expense ratio of 0.54%, which sits comfortably below the category average of 0.96%.
5. How does Alpha benefit a small-cap mutual fund?
Alpha measures a fund’s ability to outperform its benchmark index on a risk-adjusted basis. Nippon’s 10-year trailing Alpha of 6.25 indicates it has generated massive excess returns relative to the index.
6. What is the Portfolio Turnover Ratio for Nippon Small Cap Fund?
The fund maintains a low turnover ratio of roughly 19%, reflecting a structural buy-and-hold philosophy designed to let business growth compound over multi-year cycles.
Final Verdict: Is Nippon Small Cap Fund a Buy in 2026?
The Nippon India Small Cap Fund (Direct Growth) continues to establish itself as a dominant wealth-compounding vehicle within the Indian mutual fund landscape. Even as the fund manages a massive, category-leading asset size of over ₹74,600 Crores, its underlying investment framework has proven highly robust across varying macroeconomic cycles.
Rather than chasing short-term momentum, the fund’s management relies on structured diversification and a disciplined buy-and-hold philosophy (evidenced by a low 19% portfolio turnover ratio). This strategic patience allows the fund to capture business growth directly at the source.
Key Structural Takeaways
- The Time Premium: While short-term horizons expose investors to standard equity volatility, the fund’s rolling statistics show absolute dominance over extended horizons. Its Benchmark Outperformance Ratio (BOR) achieves a flawless 100% execution over 5-year, 7-year, and 10-year holding windows.
- Asymmetric Risk Management: Nippon’s active risk management shines through its long-term Alpha of 6.25 and a highly protective asymmetric profile—capturing 98% of market upsides while limiting cyclical drawdowns.
- Low Cost-to-Value Scale: Benefiting from significant economies of scale, its competitive 0.54% direct expense ratio provides a structural tailwind for investors looking to maximize compounding efficiencies over multiple years.
Final Investor Alignment & Strategy Guide
For Existing Investors (Investing over the last few years)
If you have been systematically investing in this fund over the last few years, there is no reason to alter your strategy; you should continue your SIPs uninterrupted. While its hyper-scale AUM has naturally caused short-term performance to align closer to the category average, your capital is anchored in a highly resilient framework that historically achieves its maximum outperformance gap over rolling periods exceeding 5 years.
For New Investors (Alternative Funds Screening)
If you are a new investor looking to start fresh allocations, it is highly recommended to evaluate other agile peers alongside Nippon. Specifically, when filtering for small-cap funds that have successfully beaten the benchmark index more than 75% of the time across 1-year, 2-year, and 5-year rolling horizons post-2020, the following funds stand out as premier alternatives:
Green Light (Buy/Hold): An exceptional choice for systemic equity investors (SIP allocators) and patient retail portfolios with an uncompromised investment horizon of 5+ years. If your financial goals align with capturing the core macro-growth of Indian small enterprises, this fund remains a highly reliable long-term vehicle.
Red Light (Avoid): Unsuitable for conservative capital-preservation portfolios or short-term tactical allocators with holding horizons under 3 years, where absolute small-cap volatility can disrupt near-term financial planning.