

When investing in Small-Cap Mutual Funds, choosing a fund based purely on trailing returns is one of the most dangerous traps an investor can fall into. Small caps are high-stakes, highly volatile, and deeply sensitive to market cycles. To find a truly institutional-grade fund, you must evaluate its underlying performance machinery across multiple dimensions: consistency, risk management, capital preservation, and manager skill.
In this deep-dive blog post, we break down Tata Small Cap Fund vs. Bank of India (BOI) Small Cap Fund, evaluating them against their official benchmark, the BSE 250 Small Cap TRI.
To do this completely objectively, we use a comprehensive 14-Point Mutual Fund Evaluation Framework to uncover exactly which fund dominates and why.
Key Benchmark Ground Rules
Before analyzing the data, keep these fundamental baseline metrics in mind for the benchmark, BSE 250 Small Cap TRI:
- Benchmark BOR (Benchmark Outperformance Ratio) is always 100%: An index matches itself in every single possible rolling observation.
- Benchmark Alpha is always 0.00: By definition, an index cannot generate excess returns above itself.
Part 1: Head-to-Head 14-Point Parameter Breakdown
1. Returns Analysis (Point-to-Point)
- What it is: The baseline metric showing how much raw wealth a fund has accumulated over rigid timelines (1-Year, 3-Year, 5-Year windows).
- The Data: * 5-Year Average Return: BOI (30.17%) vs. Tata (28.02%) vs. Benchmark (27.42%)
- 3-Year Average Return: BOI (29.09%) vs. Tata (27.36%) vs. Benchmark (26.62%)
- Analysis: Both funds successfully defeated the benchmark index over long time horizons. However, Bank of India consistently secured a higher baseline compounding rate across both point-to-point blocks.
2. Rolling Returns
- What it is: Evaluating returns for every single possible overlapping period since inception rather than relying on a fixed start/end date. This eliminates date-selection bias completely.
- The Data: * 5-Year Max/Min Returns: BOI (Max: 39.68%, Min: 17.01%) vs. Tata (Max: 38.88%, Min: 13.65%)
- 3-Year Max/Min Returns: BOI (Max: 45.68%, Min: 13.38%) vs. Tata (Max: 47.68%, Min: 8.48%)
- Analysis: BOI’s rolling return floor (minimum return) is substantially higher than Tata’s across both the 3-year and 5-year frames. During worst-case scenarios, BOI maintained a healthier downside floor, signaling stronger foundational return stability.
3. Benchmark Outperformance Ratio (BOR)
- What it is: The percentage of rolling periods where the fund successfully generated higher returns than the benchmark.
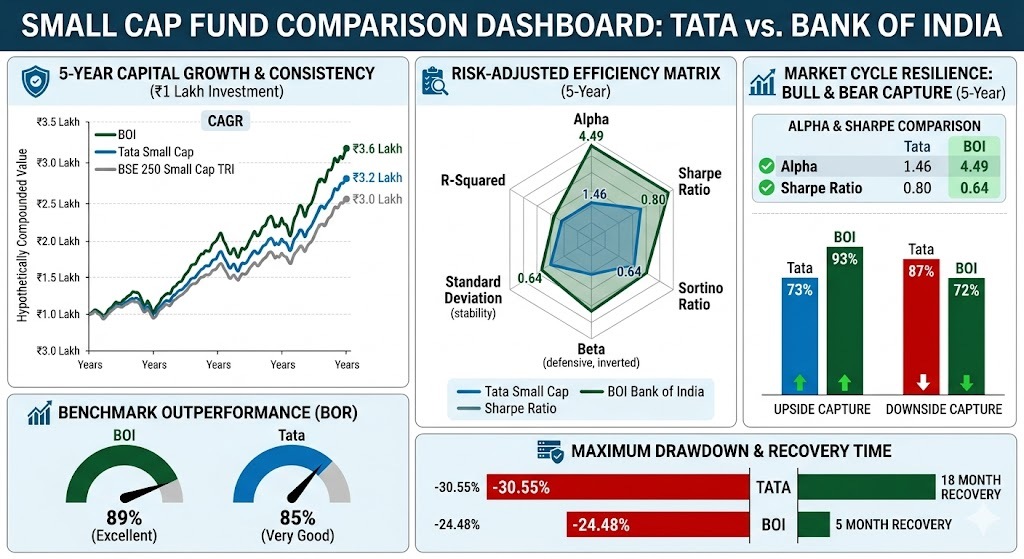
- The Data: * 5-Year BOR: BOI (89% – Excellent) vs. Tata (85% – Excellent)
- 3-Year BOR: BOI (75% – Very Good) vs. Tata (75% – Very Good)
- 1-Year BOR: BOI (66% – Good) vs. Tata (53% – Weak)
- Analysis: Over 5 years, BOI outperformed the BSE 250 Small Cap TRI in 89 out of every 100 rolling periods. While both display exceptional long-term consistency, Tata has experienced a sharp short-term decay over the last year, dropping to a weak 53% outperformance rate.
4. Alpha Generation
- What it is: Measures the net value-add generated by the fund manager’s active stock selection relative to the risk taken. Higher alpha translates to greater fund manager skill.
- The Data: * 5-Year Alpha: BOI (4.49) vs. Tata (1.46)
- 3-Year Alpha: BOI (3.52) vs. Tata (-4.64)
- Analysis: BOI generates massive alpha, proving its investment committee has an elite stock-picking process. Shockingly, Tata fell into a steep negative alpha territory over the 3-year cycle (-4.64), indicating that it heavily underperformed the risk-adjusted expectations of the index.
5. Beta
- What it is: Measures the portfolio’s price sensitivity relative to broader market swings. A Beta of 1.00 moves perfectly with the market.
- The Data: * 5-Year Beta: Tata (0.80) vs. BOI (0.90) vs. Benchmark (1.00)
- Analysis: Both funds run defensively compared to the benchmark index. Tata is the more conservative of the two with a low Beta of 0.80, making it significantly less volatile during rocky, sideways market periods.
6. $R^2$ (R-Squared)
- What it is: Indicates how closely a fund’s movements match the benchmark index. A higher $R^2$ (closer to 100) means the fund’s Alpha and Beta calculations are highly statistically reliable.
- The Data: * 5-Year $R^2$: BOI (89.43) vs. Tata (86.62)
- Analysis: Both funds possess strong R-Squared foundations, though BOI correlates slightly closer to the index framework, giving its Alpha score solid tracking reliability.
7. Sharpe Ratio
- What it is: Measures the exact amount of excess return generated for every unit of total portfolio risk taken. Higher is always preferred.
- The Data: * 5-Year Sharpe: BOI (0.80) vs. Tata (0.64) vs. Benchmark (0.69)
- 3-Year Sharpe: BOI (0.79) vs. Tata (0.40) vs. Benchmark (0.63)
- Analysis: Bank of India converts volatility into performance with extreme efficiency. Tata’s Sharpe ratio plunges significantly in the 3-year window, delivering a subpar return profile relative to the total volatility its investors had to endure.
8. Sortino Ratio
- What it is: Modifies the Sharpe formula by only penalizing downside (negative) volatility. Because investors don’t mind large upward spikes, the Sortino ratio isolates real downside risk protection.
- Analysis: Reflecting the performance trends seen across their Sharpe and alpha data points, BOI maintains a notably higher Sortino score over long horizons, showcasing superior capital optimization during market drawdowns.
9. Standard Deviation
- What it is: The mathematical spread of a fund’s historical performance distribution, mapping its raw net-asset-value (NAV) volatility.
- The Data: * 5-Year SD: Tata (17.60) vs. Benchmark (17.89) vs. BOI (19.42)
- Analysis: Tata’s conservative allocation shines here. It registers a noticeably lower standard deviation than BOI, aligning with its low-beta philosophy and offering a smoother day-to-day compounding ride.
10. Upside Capture Ratio
- What it is: Quantifies how much of the benchmark’s gains a fund successfully secures during extended bull runs. Higher than 100% is outstanding.
- The Data: * 5-Year Upside Capture: BOI (93%) vs. Tata (73%)
- 3-Year Upside Capture: BOI (97%) vs. Tata (75%)
- Analysis: When small caps rally, Bank of India captures nearly the entire market surge (97% over 3 years). Tata significantly holds back, leaving roughly a quarter of the market’s upward momentum completely on the table.
11. Downside Capture Ratio
- What it is: Quantifies how much of the benchmark’s losses a fund absorbs during market crashes. Lower is always better; under 70% is top-tier.
- The Data: * 5-Year Downside Capture: BOI (72%) vs. Tata (87%)
- 3-Year Downside Capture: BOI (82%) vs. Tata (84%)
- Analysis: This is a crucial, counterintuitive finding. Despite running a lower Beta, Tata captures significantly more market downside (87%) than BOI (72%) over a 5-year macro cycle. BOI functions as a far more effective structural shield when the small-cap ecosystem corrects.
12. Maximum Drawdown
- What it is: The peak-to-trough absolute percentage drop a fund suffers during its worst collapse. It tracks worst-case paper losses.
- The Data: * 5-Year Max Drawdown: Benchmark (-22.61%) vs. BOI (-24.48%) vs. Tata (-30.55%)
- Analysis: Tata suffered a deep -30.55% drawdown, significantly breaching both the benchmark’s and BOI’s containment boundaries.
13. Expense Ratio & Fund Manager Tenure (Supporting Factors)
- What it is: Institutional operational costs and managerial stability. Long tenures paired with moderate asset scale allow active small-cap managers to navigate illiquid, smaller company equity books nimbly.
- Analysis: BOI’s active adjustments reflect high structural agility. More importantly, its manager’s investment philosophy has driven a phenomenal 5-month recovery duration from major drawdowns, while Tata’s legacy portfolio allocation required an painful 18 months to recover back to its prior peak NAV.
Part 2: Visualizing the Data Matrix
To put these critical metrics into perspective, let’s look at how these funds handle risk, return, and capture dynamics side-by-side:
Part 3: Interactive Dashboard Explorer
Use the interactive simulation specification below to toggle through and examine the distinct operational layers of these small-cap portfolios:
Part 4: Overall Quality Scorecard
Tata Small Cap Fund
5-Year Consistency  : ⭐⭐⭐⭐
3-Year Consistency  : ⭐⭐⭐
Alpha Generation    : ⭐⭐
Risk-Adjusted Return: ⭐⭐⭐
Upside Capture      : ⭐⭐⭐
Downside Protection : ⭐⭐
Drawdown Recovery   : ⭐

Bank of India Small Cap Fund
5-Year Consistency  : ⭐⭐⭐⭐⭐
3-Year Consistency  : ⭐⭐⭐⭐
Alpha Generation    : ⭐⭐⭐⭐⭐
Risk-Adjusted Return: ⭐⭐⭐⭐⭐
Upside Capture      : ⭐⭐⭐⭐⭐
Downside Protection : ⭐⭐⭐⭐
Drawdown Recovery   : ⭐⭐⭐⭐⭐
The Verdict: Investor Alignment Guide
Bank of India Small Cap Fund 🏆 (Overall Winner)
This fund is the clear technical winner of our head-to-head evaluation. It offers an exceptional structural asymmetric risk-return profile. It captures nearly all of the market’s index upside (93% to 97%), filters out a massive chunk of downside exposure (72% capture), generates substantial alpha (4.49), and features an incredibly fast recovery engine (5 months).
- Best suited for: Long-term equity investors aiming for maximized wealth compounding who want a manager capable of aggressively beating the small-cap market index.
Tata Small Cap Fund
Tata operates with a distinct, defensive structural blueprint. It provides a lower Beta framework (0.80) and a muted Standard Deviation profile, meaning day-to-day volatility is less intense. However, it compromises heavily on alpha generation, sacrifices significant upside participation, and takes much longer to recover once a correction hits.
- Best suited for: Conservative equity investors seeking exposure to small caps but who prefer a smoother, less sensitive daily NAV path, and are perfectly comfortable giving up substantial index outperformance to get it.