

Description
Explore our Invesco India Small Cap Direct Fund 2026 review, covering long-term CAGR, rolling returns, key risk metrics and BOR.
Introduction
Small-cap mutual funds invest mainly in smaller companies. These companies can become much bigger in the future, so they have the potential to create good wealth over a long period. But there is also a risk: their prices can go up and down very quickly.
Invesco India Small Cap Fund – Direct Plan – Growth is one such small-cap fund. In this article, we will study the fund using its CAGR returns, rolling returns, Benchmark Outperformance Ratio (BOR), risk ratios, upside and downside capture, portfolio allocation and fundamental data.
The main question is simple:
Has Invesco India Small Cap Fund been able to give good returns without taking too much extra risk?
Based on the data provided, the fund has shown strong historical performance, especially over 3-year, 5-year and 7-year periods. Its rolling-return and BOR numbers are also impressive.
However, there is one important concern. The stocks held by the fund currently have higher valuations than the small-cap category average, while their sales growth is lower than the category average.
So, let’s look at the fund step by step in very simple language.
Disclaimer: This article is for educational and research purposes only. It is not a recommendation to buy, sell or hold any mutual fund. Mutual fund investments are subject to market risks. Please consider your financial goals, risk level and investment horizon and consult a qualified financial adviser before investing.
Invesco India Small Cap Direct Fund CAGR Returns
Let’s first look at the fund’s returns.
| Period | Invesco India Small Cap | BSE 250 SmallCap TRI | Small Cap Category |
|---|---|---|---|
| YTD | 12.70% | 5.54% | 9.99% |
| 1 Month | 1.33% | -0.15% | 1.40% |
| 3 Months | 10.57% | 5.52% | 8.24% |
| 6 Months | 20.75% | 15.66% | 18.45% |
| 1 Year | 11.82% | 1.44% | 7.65% |
| 3 Years CAGR | 23.78% | 15.39% | 18.04% |
| 5 Years CAGR | 20.25% | 14.60% | 16.81% |
| 7 Years CAGR | 27.15% | 20.90% | 24.30% |
What do these numbers tell us?
The long-term numbers are particularly impressive.
The past 3 years, Invesco delivered 23.78% CAGR, while the benchmark delivered 15.39%.
The past 5 years, the fund delivered 20.25% CAGR, compared with 14.60% for the benchmark.
Over the past 7 years, the fund delivered 27.15% CAGR, while the benchmark delivered 20.90%.
This means the fund has created significantly higher returns than the benchmark over these periods.
What is CAGR?
CAGR means Compound Annual Growth Rate.
Don’t worry about the complicated name.
Imagine you put ₹100 into a fund and leave it for several years. CAGR tells you the average yearly growth rate that would turn ₹100 into the final amount, assuming the money grew at a steady rate.
Actual returns do not grow at the same rate every year. Some years can be very good and some years can be bad.
Therefore, CAGR is useful for understanding long-term growth, but it does not show the ups and downs in between.
Our view on CAGR returns
3-year performance → 🟢 Strong
5-year performance → 🟢 Strong
7-year performance → 🟢 Excellent
The fund’s long-term CAGR is one of its biggest strengths.
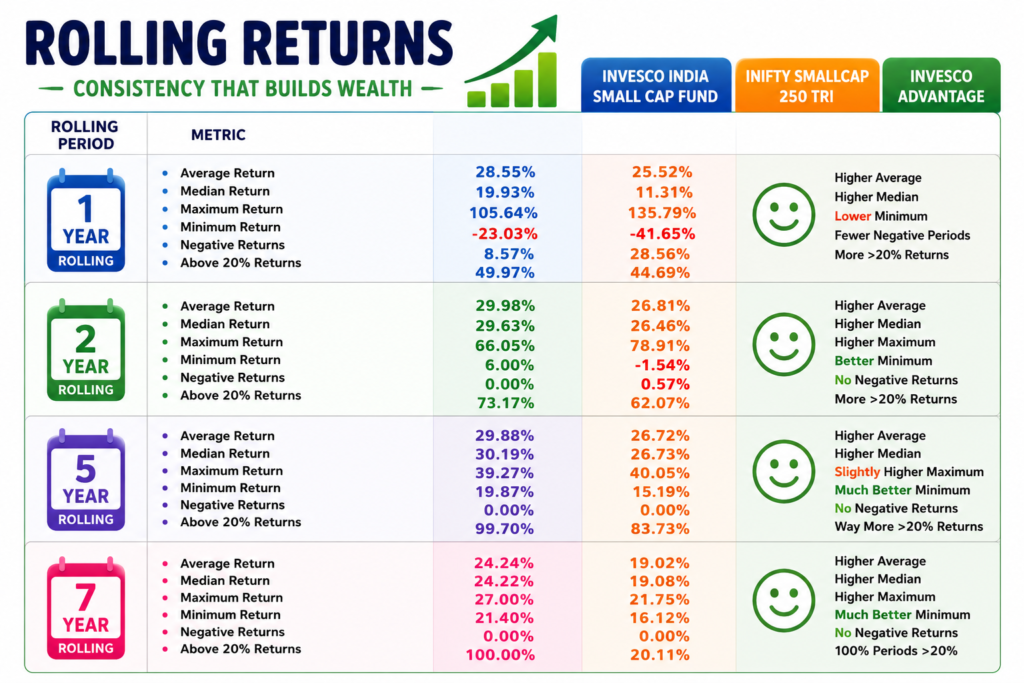
Invesco India Small Cap Direct Fund Rolling Returns
1-Year Rolling Returns
| Metric | Invesco | Nifty Smallcap 250 TRI |
|---|---|---|
| Average | 28.55% | 25.52% |
| Median | 19.93% | 11.31% |
| Maximum | 105.64% | 135.79% |
| Minimum | -23.03% | -41.65% |
| Negative Returns | 8.57% | 28.56% |
| Above 20% | 49.97% | 44.69% |
The fund’s average rolling return was higher than the benchmark.
More importantly, the fund had negative 1-year rolling returns 8.57% of the time, compared with 28.56% for the benchmark.
The fund’s worst 1-year rolling return was -23.03%, while the benchmark’s worst was -41.65%.
This suggests that the fund showed better downside behavior in the supplied data.
2-Year Rolling Returns
| Metric | Invesco | Nifty Smallcap 250 TRI |
|---|---|---|
| Average | 29.98% | 26.81% |
| Median | 29.63% | 26.46% |
| Maximum | 66.05% | 78.91% |
| Minimum | 6.06% | -1.54% |
| Negative Returns | 0% | 0.57% |
| Above 20% | 73.17% | 62.07% |
The 2-year rolling data is also strong.
The fund’s average return was 29.98%, compared with 26.81% for the benchmark.
The minimum rolling return was 6.06%, while the benchmark’s minimum was -1.54%.
5-Year Rolling Returns
This is one of the strongest parts of the analysis.
| Metric | Invesco | Nifty Smallcap 250 TRI |
|---|---|---|
| Average | 29.88% | 26.72% |
| Median | 30.19% | 26.73% |
| Maximum | 39.27% | 40.05% |
| Minimum | 19.87% | 15.19% |
| Negative Returns | 0% | 0% |
| Above 20% | 99.70% | 83.73% |
The fund’s average 5-year rolling return was 29.88%.
The benchmark’s average was 26.72%.
The fund’s minimum rolling return was 19.87%, compared with 15.19% for the benchmark.
Most impressive is that 99.70% of the fund’s 5-year rolling periods delivered more than 20% annualized returns in the supplied dataset.
7-Year Rolling Returns
The 7-year numbers are even stronger.
| Metric | Invesco | Nifty Smallcap 250 TRI |
|---|---|---|
| Average | 24.24% | 19.02% |
| Median | 24.22% | 19.08% |
| Maximum | 27.00% | 21.75% |
| Minimum | 21.40% | 16.12% |
| Negative Returns | 0% | 0% |
| Above 20% | 100% | 20.11% |
According to the supplied data, 100% of Invesco’s 7-year rolling periods generated more than 20% annualized returns.
The fund’s minimum 7-year rolling return was 21.40%.
The benchmark’s minimum was 16.12%.
Rolling-return conclusion for Invesco India Small Cap Fund
The rolling-return data gives us an important message:
The fund’s strong performance was not limited to one particular starting date. It remained strong across many different rolling periods.
However, these are historical results. They should not be treated as a promise of future returns.
Important data note
The 3-year rolling-return table supplied earlier contains exactly the same numbers as the 2-year table. Therefore, those 3-year figures should be verified from the original source before publishing them as 3-year rolling returns.
Invesco Small Cap Fund Benchmark Outperformance Ratio
Rolling returns tell us how the fund performed across different periods.
But we also want to know:
How many times did the fund actually beat the benchmark?
This is where Benchmark Outperformance Ratio (BOR) is useful.
BOR in simple words
If a fund beats the benchmark 80 times out of 100 periods, its BOR is 80%.
So, a higher BOR generally means more consistent benchmark outperformance.
Invesco India Small Cap Fund BOR
| Rolling Period | Total Cycles | Beat Benchmark | Underperformed | BOR |
|---|---|---|---|---|
| 1 Year | 1,657 | 1,259 | 398 | 76% |
| 2 Years | 1,409 | 1,251 | 158 | 89% |
| 3 Years | 1,163 | 1,008 | 155 | 87% |
| 5 Years | 669 | 544 | 125 | 81% |
| 7 Years | 177 | 177 | 0 | 100% |
1-Year BOR – 76%
The fund beat the benchmark in 1,259 out of 1,657 periods.
So, it won in roughly 3 out of every 4 periods.
That is a good result.
2-Year BOR – 89%
The fund beat the benchmark in 1,251 out of 1,409 periods.
This means it won in almost 9 out of every 10 rolling periods.
3-Year BOR – 87%
The fund beat the benchmark in 1,008 out of 1,163 periods.
Again, this shows strong consistency.
5-Year BOR – 81%
The fund beat the benchmark in 544 out of 669 periods.
So even over a longer 5-year period, the fund beat the benchmark in more than 8 out of 10 periods.
7-Year BOR – 100%
This is the most impressive number.
The fund beat the benchmark in:
177 out of 177 periods.
So the BOR is 100%.
This is a very strong historical result.
Important point about BOR
BOR tells us how often the fund won.
It does not tell us how much it won by.
Therefore, BOR should always be studied along with rolling returns, Alpha, Sharpe ratio and other risk measures.
Invesco India Small Cap Fund Risk Parameters
3 Year Risk Parameters for Invesco India Small Cap Fund
Returns are only one part of the story.
We also need to understand how much risk the fund took to generate those returns.
Here are the 3-year numbers:
| Risk Parameter | Invesco | Category | Index |
|---|---|---|---|
| Alpha | 6.44 | 0.17 | 0.68 |
| Beta | 0.84 | 0.86 | 0.85 |
| R² | 89.77 | 92.03 | 91.77 |
| Sharpe Ratio | 0.93 | 0.62 | 0.64 |
| Standard Deviation | 19.66% | 19.79% | 19.88% |
| Upside Capture | 96 | 86 | 85 |
| Downside Capture | 72 | 81 | 80 |
| Maximum Drawdown | -20.60% | -22.61% | -18.62% |
Alpha – 6.44
Alpha tells us about the extra return generated compared with what the benchmark would suggest.
The fund’s Alpha is 6.44.
The category Alpha is 0.17.
The index Alpha is 0.68.
So the fund has a strong Alpha in the supplied 3-year data.
Simple explanation
Imagine two students are given the same test.
One student gets 70 marks.
The other gets 85.
The second student performed better.
Alpha is somewhat like looking at the extra performance after considering the market benchmark.
Beta – 0.84
Beta tells us how strongly the fund tends to move when the benchmark moves.
A Beta below 1 generally means the fund has moved less than the benchmark.
The fund’s Beta is 0.84.
Category = 0.86
Index = 0.85
So the fund’s market sensitivity is slightly lower than the category and similar to the index.
R² – 89.77
R² tells us how closely the fund’s movements are related to its benchmark.
The fund’s R² is 89.77.
This indicates a strong relationship with the benchmark.
For a small-cap fund, this is useful because it shows that a large part of the fund’s movement is related to the broader small-cap market.
Sharpe Ratio – 0.93
Sharpe ratio is a very useful risk-adjusted return measure.
A higher number is generally better.
Invesco = 0.93
Category = 0.62
Index = 0.64
The fund’s Sharpe ratio is clearly higher.
This suggests the fund generated better returns for the amount of risk taken during the measured period.
Standard Deviation – 19.66%
Standard deviation tells us how much returns move up and down.
Lower generally means lower volatility.
Invesco = 19.66%
Category = 19.79%
Index = 19.88%
The fund’s volatility was slightly lower than both.
That is a positive.
5-Year Risk Parameters for Invesco India Small Cap Fund
Now let’s look at the longer 5-year period.
| Risk Parameter | Invesco | Category | Index |
|---|---|---|---|
| Alpha | 5.89 | 2.21 | 2.33 |
| Beta | 0.83 | 0.82 | 0.83 |
| R² | 88.87 | 89.60 | 89.86 |
| Sharpe Ratio | 0.88 | 0.68 | 0.68 |
| Standard Deviation | 17.92% | 17.83% | 17.30% |
| Upside Capture | 93 | 85 | 86 |
| Downside Capture | 67 | 72 | 70 |
| Maximum Drawdown | -20.60% | -22.61% | -18.62% |
Alpha – 5.89
The 5-year Alpha is 5.89.
This is much higher than:
- Category: 2.21
- Index: 2.33
This supports the idea that the fund’s historical outperformance has not been limited to a very short period.
Beta – 0.83
The 5-year Beta is 0.83.
It is almost the same as the index and slightly higher than the category.
Overall, the fund has moderate sensitivity to benchmark movements.
Sharpe Ratio – 0.88
The fund’s 5-year Sharpe ratio is 0.88.
The category and index are both at 0.68.
Again, the fund has produced stronger risk-adjusted returns.
This is an important positive for the fund.
Standard Deviation – 17.92%
The fund’s standard deviation is slightly higher than the index.
- Fund: 17.92%
- Category: 17.83%
- Index: 17.30%
So the fund isn’t the lowest-volatility option.
But the difference is not very large, while the fund’s Sharpe ratio is significantly better.
Invesco India Upside and Downside Capture Ratio
Upside and downside capture ratios help us understand how the fund behaved when the market went up and when it went down.
What is Upside Capture?
It tells us how much of the benchmark’s positive performance the fund captured.
What is Downside Capture?
It tells us how much of the benchmark’s negative performance the fund experienced.
For downside capture, lower is generally better.
3-Year Capture Ratios
| Measure | Invesco | Category | Index |
|---|---|---|---|
| Upside Capture | 96 | 86 | 85 |
| Downside Capture | 72 | 81 | 80 |
The fund’s upside capture of 96 is higher than both the category and index.
Its downside capture of 72 is lower than both.
This is a good combination.
5-Year Capture Ratios
| Measure | Invesco | Category | Index |
|---|---|---|---|
| Upside Capture | 93 | 85 | 86 |
| Downside Capture | 67 | 72 | 70 |
The 5-year numbers are even more interesting.
The fund captured 93% of the benchmark’s upside while its downside capture was only 67%.
In simple language:
The fund participated strongly when the market went up, while historically taking less of the market’s fall than the category and index.
This is one of the strongest points in the fund’s risk analysis.
Portfolio Allocation Details
Now let’s look at what the fund actually owns.
Asset Allocation
| Asset | Allocation |
|---|---|
| Equity | 98.74% |
| Debt | 0.00% |
| Cash | 1.26% |
| Derivatives | 0.00% |
Almost 99% of the portfolio is invested in equity.
This is normal for a small-cap fund.
But it also means investors should be prepared for large market movements.
Market-Cap Allocation
| Market Cap | Allocation |
|---|---|
| Small Cap | 61.50% |
| Mid Cap | 16.83% |
| Large Cap | 13.89% |
| Others | 7.78% |
The fund has 61.50% in small-cap companies.
This confirms that the fund has a strong small-cap focus.
It also has 16.83% in mid-cap companies and 13.89% in large-cap companies.
This gives the fund some diversification beyond small caps.
Number of Stocks
The fund holds 69 stocks.
This is a reasonably diversified portfolio.
If one company performs badly, the entire portfolio does not depend only on that company.
However, diversification does not remove small-cap market risk.
Top 10 Stocks
The top 10 stocks account for:
37.37%
That means around 62.63% is invested outside the top 10 stocks.
This suggests reasonable diversification at the stock level.
Top 5 Stocks
The top five stocks account for:
22.14%
So the fund is not extremely dependent on just five companies.
Top 3 Sectors
The top three sectors account for:
62.33%
This is something investors should watch.
The fund may hold 69 stocks, but a large amount of money is still concentrated in three sectors.
Therefore:
Stock diversification → Good
Sector diversification → Needs moni
Fundamental Analysis For Invesco India Small Cap Fund
Now let’s look at the quality and valuation of the companies held by the fund.
| Fundamental Measure | Fund | Category Average |
|---|---|---|
| P/E | 38.21 | 29.98 |
| P/B | 5.15 | 4.03 |
| Price/Sales | 3.40 | 3.11 |
| Price/Cash Flow | 23.50 | 23.26 |
| Dividend Yield | 0.46% | 0.74% |
| Sales Growth | 11.27% | 15.27% |
This section gives us a mixed picture.
P/E Ratio
The fund’s P/E is 38.21.
The category average is 29.98.
So investors are paying more for the earnings of companies in this portfolio.
A higher P/E does not automatically mean the fund is bad.
But it does mean the portfolio has a higher valuation.
P/B Ratio
The fund’s P/B is 5.15.
The category average is 4.03.
Again, the fund’s portfolio is trading at a premium.
Price/Sales
The fund has a Price/Sales ratio of 3.40.
The category average is 3.11.
The difference is smaller than the P/E difference, but the fund is still slightly more expensive.
Price/Cash Flow
Here the numbers are almost identical:
Fund = 23.50
Category = 23.26
So this metric does not show a major difference.
Dividend Yield
The fund’s dividend yield is 0.46%.
The category average is 0.74%.
For a growth-focused small-cap portfolio, a lower dividend yield is not necessarily a major problem.
Companies may keep their profits to grow their businesses instead of paying large dividends.
Sales Growth – An Important Concern
The fund’s sales growth is:
11.27%
Category average:
15.27%
So the fund’s portfolio companies have lower sales growth than the category average.
This is the biggest fundamental point to watch.
The fund has:
Higher valuation + lower sales growth
This does not mean the fund will perform badly.
But it means investors should monitor whether future earnings and sales growth are strong enough to support the current valuations.
Final Words About Invesco India Small Cap Fund Direct Growth
After looking at all the available information, Invesco India Small Cap Fund has a strong historical performance record.
The 3-year CAGR is 23.78%.
The 5-year CAGR is 20.25%.
The 7-year CAGR is 27.15%.
The rolling-return analysis also shows strong results.
The 5-year average rolling return was 29.88%, while the benchmark delivered 26.72%.
The 7-year average rolling return was 24.24%, compared with 19.02% for the benchmark.
The BOR numbers are also impressive.
The fund beat the benchmark in 81% of 5-year rolling periods and 100% of the 7-year rolling periods in the supplied data.
The risk analysis provides more positive information.
The 3-year Sharpe ratio was 0.93, while the 5-year Sharpe ratio was 0.88.
The fund’s downside capture was also better than the category and index.
The portfolio is well spread across 69 stocks, with 61.50% in small caps.
But there are some concerns.
The portfolio’s P/E of 38.21 is much higher than the category average of 29.98.
The P/B is also higher.
More importantly, the portfolio’s sales growth of 11.27% is below the category average of 15.27%.
The top three sectors also account for 62.33% of the portfolio.
Overall conclusion
Invesco India Small Cap Fund looks strong based on its historical returns, rolling performance, benchmark outperformance and risk-adjusted returns. However, its relatively high portfolio valuation and lower sales growth require careful monitoring. The fund may be interesting for investors who have a long investment horizon and can handle the high risk of small-cap investing, but past performance should never be treated as a guarantee of future returns.
In very simple words:
The fund has played very well in the past. Its long-term scorecard looks strong. But the stocks it owns are not cheap, so investors should watch future growth and valuations carefully.
10. Frequently Asked Questions
1. Is Invesco India Small Cap Fund a good fund?
Based on the data provided, the fund has shown strong historical performance. Its long-term returns, rolling returns, BOR, Alpha and Sharpe ratio are all positive points.
However, whether it is suitable for you depends on your financial goals, risk tolerance and investment horizon.
2. Is Invesco India Small Cap Fund high risk?
Yes.
Small-cap funds are generally considered high-risk investments because smaller companies can experience large price movements.
Investors should be prepared for temporary losses and market volatility.
3. What is the 5-year return of Invesco India Small Cap Fund?
The provided 5-year CAGR is 20.25%.
The BSE 250 SmallCap TRI returned 14.60% over the same period in the supplied data.
4. What is the 7-year return?
The fund’s 7-year CAGR is 27.15%.
The benchmark returned 20.90%.
5. What is the 5-year rolling return?
The fund’s average 5-year rolling return in the supplied data is 29.88%, compared with 26.72% for the benchmark.
6. What is the 7-year BOR of Invesco India Small Cap Fund?
The 7-year BOR is 100% based on the supplied data.
The fund beat the benchmark in all 177 observed 7-year rolling periods.
7. What is the 5-year Sharpe ratio?
The fund’s 5-year Sharpe ratio is 0.88.
The category and index both have a Sharpe ratio of 0.68 in the supplied data.
8. What is the downside capture ratio?
The 5-year downside capture ratio is 67.
This is lower than the category’s 72 and the index’s 70.
A lower downside capture ratio is generally considered better because it indicates that the fund participated less in the benchmark’s negative movements.
9. How many stocks does the fund hold?
The portfolio contains 69 stocks based on the data provided.
10. How much does the fund invest in small-cap stocks?
The fund has approximately 61.50% in small-cap stocks.
It also has:
- 16.83% in mid caps
- 13.89% in large caps
- 7.78% in others
11. Is the fund’s portfolio expensive?
Compared with the category average, yes, the portfolio appears relatively expensive.
The fund’s P/E is 38.21 compared with 29.98 for the category.
Its P/B is 5.15 compared with 4.03.
12. What is the biggest concern with the fund?
The biggest concern from the supplied fundamental data is the combination of higher valuation and lower sales growth.
The portfolio’s sales growth is 11.27%, while the category average is 15.27%.
Investors should monitor whether future business growth can justify the portfolio’s valuation.
13. Who should consider a small-cap fund like this?
Small-cap funds are generally more suitable for investors who:
- Have a long investment horizon
- Can handle large ups and downs
- Understand that returns are not guaranteed
- Do not need the invested money in the short term
- Have an overall portfolio that matches their risk level
They may not be suitable for investors who cannot tolerate temporary large losses.
14. Should investors invest only because the fund has a high BOR?
No.
BOR is only one metric.
A good fund review should also look at:
Rolling Returns + BOR + Alpha + Sharpe + Drawdown + Portfolio + Valuation + Growth
Looking at all these factors gives a much better picture.
Final Rating Based on the Data Provided
| Area | View |
|---|---|
| CAGR Returns | 🟢 Excellent |
| Rolling Returns | 🟢 Excellent |
| Benchmark Outperformance | 🟢 Excellent |
| 3-Year Risk Metrics | 🟢 Strong |
| 5-Year Risk Metrics | 🟢 Strong |
| Upside Capture | 🟢 Strong |
| Downside Capture | 🟢 Strong |
| Portfolio Diversification | 🟢 Good |
| Small-Cap Exposure | 🟢 Strong |
| Valuation | 🟡 Expensive |
| Sales Growth | 🟡 Needs Attention |
| Sector Concentration | 🟡 Needs Monitoring |
| Overall Historical Score | 🟢 Strong |
Final Words & Disclaimer
The entire analysis in this article, including CAGR returns, rolling returns, Benchmark Outperformance Ratio (BOR), Alpha, Beta, Sharpe Ratio, Standard Deviation, Maximum Drawdown, Upside and Downside Capture Ratios, portfolio allocation and fundamental analysis, is provided strictly for educational and informational purposes.
This article is not a recommendation to buy, sell or hold Invesco India Small Cap Fund or any other mutual fund. The analysis is based on historical data, and past performance does not guarantee future returns.
Mutual fund investments are subject to market risks, and small-cap mutual funds can experience significant ups and downs. Investors should carefully understand the risks before investing.
Before making any investment decision, consider your financial goals, investment horizon and risk tolerance, and take advice from a SEBI-registered investment adviser or other qualified financial professional if required.
Please do your own research and make an informed decision before investing. Never invest simply because a fund has delivered good returns in the past.